Slovak vs Immigrants from Hong Kong 2 or more Vehicles in Household
COMPARE
Slovak
Immigrants from Hong Kong
2 or more Vehicles in Household
2 or more Vehicles in Household Comparison
Slovaks
Immigrants from Hong Kong
58.0%
2 OR MORE VEHICLES IN HOUSEHOLD
99.2/ 100
METRIC RATING
85th/ 347
METRIC RANK
52.6%
2 OR MORE VEHICLES IN HOUSEHOLD
0.6/ 100
METRIC RATING
257th/ 347
METRIC RANK
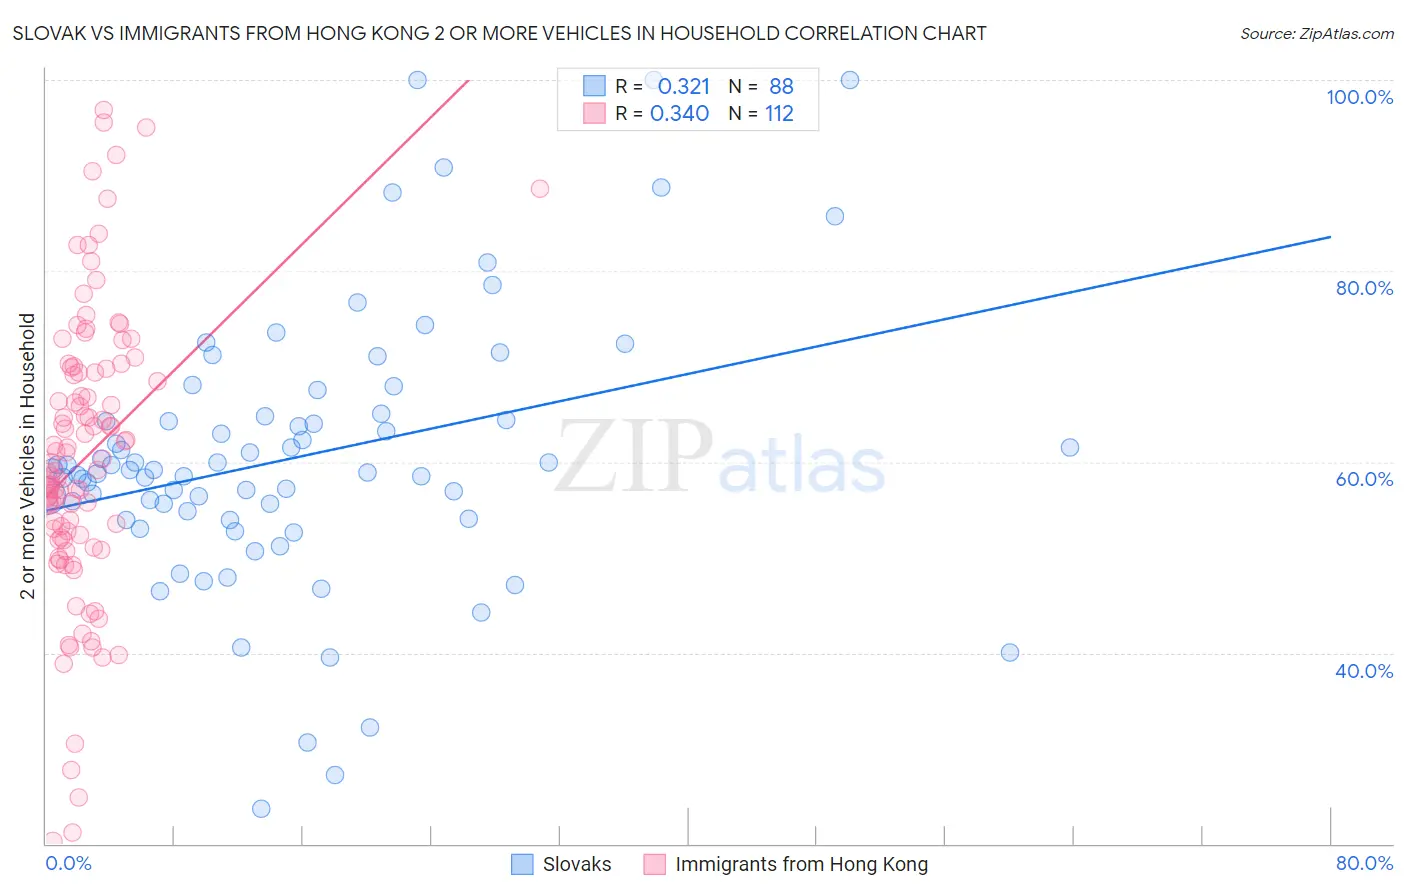
Slovak vs Immigrants from Hong Kong 2 or more Vehicles in Household Correlation Chart
The statistical analysis conducted on geographies consisting of 397,714,521 people shows a mild positive correlation between the proportion of Slovaks and percentage of households with 2 or more vehicles available in the United States with a correlation coefficient (R) of 0.321 and weighted average of 58.0%. Similarly, the statistical analysis conducted on geographies consisting of 253,902,062 people shows a mild positive correlation between the proportion of Immigrants from Hong Kong and percentage of households with 2 or more vehicles available in the United States with a correlation coefficient (R) of 0.340 and weighted average of 52.6%, a difference of 10.3%.
2 or more Vehicles in Household Correlation Summary
| Measurement | Slovak | Immigrants from Hong Kong |
| Minimum | 23.6% | 20.2% |
| Maximum | 100.0% | 96.9% |
| Range | 76.4% | 76.6% |
| Mean | 60.5% | 60.4% |
| Median | 59.1% | 59.5% |
| Interquartile 25% (IQ1) | 54.5% | 52.0% |
| Interquartile 75% (IQ3) | 64.6% | 69.6% |
| Interquartile Range (IQR) | 10.1% | 17.6% |
| Standard Deviation (Sample) | 14.2% | 15.1% |
| Standard Deviation (Population) | 14.1% | 15.0% |
Similar Demographics by 2 or more Vehicles in Household
Demographics Similar to Slovaks by 2 or more Vehicles in Household
In terms of 2 or more vehicles in household, the demographic groups most similar to Slovaks are Potawatomi (58.0%, a difference of 0.030%), Maltese (58.0%, a difference of 0.050%), Thai (57.9%, a difference of 0.070%), Icelander (58.0%, a difference of 0.080%), and Immigrants from Iran (57.9%, a difference of 0.080%).
| Demographics | Rating | Rank | 2 or more Vehicles in Household |
| Lithuanians | 99.5 /100 | #78 | Exceptional 58.2% |
| Delaware | 99.4 /100 | #79 | Exceptional 58.2% |
| Immigrants | England | 99.3 /100 | #80 | Exceptional 58.1% |
| Immigrants | Iraq | 99.3 /100 | #81 | Exceptional 58.1% |
| Iranians | 99.3 /100 | #82 | Exceptional 58.1% |
| Icelanders | 99.2 /100 | #83 | Exceptional 58.0% |
| Maltese | 99.2 /100 | #84 | Exceptional 58.0% |
| Slovaks | 99.2 /100 | #85 | Exceptional 58.0% |
| Potawatomi | 99.1 /100 | #86 | Exceptional 58.0% |
| Thais | 99.1 /100 | #87 | Exceptional 57.9% |
| Immigrants | Iran | 99.1 /100 | #88 | Exceptional 57.9% |
| Immigrants | Germany | 99.0 /100 | #89 | Exceptional 57.9% |
| Hispanics or Latinos | 99.0 /100 | #90 | Exceptional 57.9% |
| Pakistanis | 99.0 /100 | #91 | Exceptional 57.9% |
| Shoshone | 99.0 /100 | #92 | Exceptional 57.9% |
Demographics Similar to Immigrants from Hong Kong by 2 or more Vehicles in Household
In terms of 2 or more vehicles in household, the demographic groups most similar to Immigrants from Hong Kong are Central American Indian (52.5%, a difference of 0.10%), Immigrants from Eritrea (52.6%, a difference of 0.14%), Alsatian (52.5%, a difference of 0.14%), Uruguayan (52.7%, a difference of 0.18%), and Immigrants from Bahamas (52.5%, a difference of 0.20%).
| Demographics | Rating | Rank | 2 or more Vehicles in Household |
| Mongolians | 1.0 /100 | #250 | Tragic 52.8% |
| Immigrants | Sudan | 1.0 /100 | #251 | Tragic 52.8% |
| Immigrants | Portugal | 1.0 /100 | #252 | Tragic 52.8% |
| Nigerians | 0.9 /100 | #253 | Tragic 52.8% |
| Immigrants | Malaysia | 0.8 /100 | #254 | Tragic 52.7% |
| Uruguayans | 0.7 /100 | #255 | Tragic 52.7% |
| Immigrants | Eritrea | 0.7 /100 | #256 | Tragic 52.6% |
| Immigrants | Hong Kong | 0.6 /100 | #257 | Tragic 52.6% |
| Central American Indians | 0.6 /100 | #258 | Tragic 52.5% |
| Alsatians | 0.6 /100 | #259 | Tragic 52.5% |
| Immigrants | Bahamas | 0.5 /100 | #260 | Tragic 52.5% |
| Immigrants | Australia | 0.5 /100 | #261 | Tragic 52.4% |
| Immigrants | Northern Africa | 0.4 /100 | #262 | Tragic 52.3% |
| Immigrants | Southern Europe | 0.4 /100 | #263 | Tragic 52.3% |
| Immigrants | Latvia | 0.4 /100 | #264 | Tragic 52.2% |