Slovak vs Welsh Currently Married

COMPARE

Slovak
Race
Ancestry
AfghanAfricanAlaska NativeAlaskan AthabascanAlbanianAleutAlsatianAmericanApacheArabArapahoArgentineanArmenianAssyrian/Chaldean/SyriacAustralianAustrianBahamianBangladeshiBarbadianBasqueBelgianBelizeanBermudanBhutaneseBlackfeetBolivianBrazilianBritishBritish West IndianBulgarianBurmeseCajunCambodianCanadianCape VerdeanCarpatho RusynCelticCentral AmericanCentral American IndianCherokeeCheyenneChickasawChileanChineseChippewaChoctawColombianColvilleComancheCosta RicanCreeCreekCroatianCrowCubanCypriotCzechCzechoslovakianDanishDelawareDominicanDutchDutch West IndianEastern EuropeanEcuadorianEgyptianEnglishEstonianEthiopianEuropeanFijianFilipinoFinnishFrenchFrench American IndianFrench CanadianGermanGerman RussianGhanaianGreekGuamanian/ChamorroGuatemalanGuyaneseHaitianHmongHonduranHopiHoumaHungarianIcelanderIndian (Asian)IndonesianInupiatIranianIraqiIrishIroquoisIsraeliItalianJamaicanJapaneseJordanianKenyanKiowaKoreanLaotianLatvianLebaneseLiberianLithuanianLumbeeLuxembourgerMacedonianMalaysianMalteseMarshalleseMenomineeMexicanMexican American IndianMongolianMoroccanNative HawaiianNavajoNepaleseNew ZealanderNicaraguanNigerianNorthern EuropeanNorwegianOkinawanOsageOttawaPaiutePakistaniPalestinianPanamanianParaguayanPennsylvania GermanPeruvianPimaPolishPortuguesePotawatomiPuebloPuerto RicanPuget Sound SalishRomanianRussianSalvadoranSamoanScandinavianScotch-IrishScottishSeminoleSenegaleseSerbianShoshoneSierra LeoneanSiouxSlavicSlovakSloveneSomaliSouth AfricanSouth AmericanSouth American IndianSoviet UnionSpaniardSpanishSpanish AmericanSpanish American IndianSri LankanSubsaharan AfricanSudaneseSwedishSwissSyrianTaiwaneseThaiTlingit-HaidaTohono O'OdhamTonganTrinidadian and TobagonianTsimshianTurkishU.S. Virgin IslanderUgandanUkrainianUruguayanUteVenezuelanVietnameseWest IndianYakamaYaquiYugoslavianYumanYup'ikZimbabwean
Immigration
NonimmigrantsImmigrantsAfghanistanAfricaAlbaniaArgentinaArmeniaAsiaAustraliaAustriaBahamasBangladeshBarbadosBelarusBelgiumBelizeBoliviaBosnia and HerzegovinaBrazilBulgariaBurma/MyanmarCabo VerdeCambodiaCameroonCanadaCaribbeanCentral AmericaChileChinaColombiaCongoCosta RicaCroatiaCubaCzechoslovakiaDenmarkDominicaDominican RepublicEastern AfricaEastern AsiaEastern EuropeEcuadorEgyptEl SalvadorEnglandEritreaEthiopiaEuropeFijiFranceGermanyGhanaGreeceGrenadaGuatemalaGuyanaHaitiHondurasHong KongHungaryIndiaIndonesiaIranIraqIrelandIsraelItalyJamaicaJapanJordanKazakhstanKenyaKoreaKuwaitLaosLatin AmericaLatviaLebanonLiberiaLithuaniaMalaysiaMexicoMicronesiaMiddle AfricaMoldovaMoroccoNepalNetherlandsNicaraguaNigeriaNorth AmericaNorth MacedoniaNorthern AfricaNorthern EuropeNorwayOceaniaPakistanPanamaPeruPhilippinesPolandPortugalRomaniaRussiaSaudi ArabiaScotlandSenegalSerbiaSierra LeoneSingaporeSomaliaSouth AfricaSouth AmericaSouth Central AsiaSouth Eastern AsiaSouthern EuropeSpainSri LankaSt. Vincent and the GrenadinesSudanSwedenSwitzerlandSyriaTaiwanThailandTrinidad and TobagoTurkeyUgandaUkraineUruguayUzbekistanVenezuelaVietnamWest IndiesWestern AfricaWestern AsiaWestern EuropeYemenZaireZimbabweAzores
Welsh
Race
Ancestry
AfghanAfricanAlaska NativeAlaskan AthabascanAlbanianAleutAlsatianAmericanApacheArabArapahoArgentineanArmenianAssyrian/Chaldean/SyriacAustralianAustrianBahamianBangladeshiBarbadianBasqueBelgianBelizeanBermudanBhutaneseBlackfeetBolivianBrazilianBritishBritish West IndianBulgarianBurmeseCajunCambodianCanadianCape VerdeanCarpatho RusynCelticCentral AmericanCentral American IndianCherokeeCheyenneChickasawChileanChineseChippewaChoctawColombianColvilleComancheCosta RicanCreeCreekCroatianCrowCubanCypriotCzechCzechoslovakianDanishDelawareDominicanDutchDutch West IndianEastern EuropeanEcuadorianEgyptianEnglishEstonianEthiopianEuropeanFijianFilipinoFinnishFrenchFrench American IndianFrench CanadianGermanGerman RussianGhanaianGreekGuamanian/ChamorroGuatemalanGuyaneseHaitianHmongHonduranHopiHoumaHungarianIcelanderIndian (Asian)IndonesianInupiatIranianIraqiIrishIroquoisIsraeliItalianJamaicanJapaneseJordanianKenyanKiowaKoreanLaotianLatvianLebaneseLiberianLithuanianLumbeeLuxembourgerMacedonianMalaysianMalteseMarshalleseMenomineeMexicanMexican American IndianMongolianMoroccanNative HawaiianNavajoNepaleseNew ZealanderNicaraguanNigerianNorthern EuropeanNorwegianOkinawanOsageOttawaPaiutePakistaniPalestinianPanamanianParaguayanPennsylvania GermanPeruvianPimaPolishPortuguesePotawatomiPuebloPuerto RicanPuget Sound SalishRomanianRussianSalvadoranSamoanScandinavianScotch-IrishScottishSeminoleSenegaleseSerbianShoshoneSierra LeoneanSiouxSlavicSloveneSomaliSouth AfricanSouth AmericanSouth American IndianSoviet UnionSpaniardSpanishSpanish AmericanSpanish American IndianSri LankanSubsaharan AfricanSudaneseSwedishSwissSyrianTaiwaneseThaiTlingit-HaidaTohono O'OdhamTonganTrinidadian and TobagonianTsimshianTurkishU.S. Virgin IslanderUgandanUkrainianUruguayanUteVenezuelanVietnameseWelshWest IndianYakamaYaquiYugoslavianYumanYup'ikZimbabwean
Immigration
NonimmigrantsImmigrantsAfghanistanAfricaAlbaniaArgentinaArmeniaAsiaAustraliaAustriaBahamasBangladeshBarbadosBelarusBelgiumBelizeBoliviaBosnia and HerzegovinaBrazilBulgariaBurma/MyanmarCabo VerdeCambodiaCameroonCanadaCaribbeanCentral AmericaChileChinaColombiaCongoCosta RicaCroatiaCubaCzechoslovakiaDenmarkDominicaDominican RepublicEastern AfricaEastern AsiaEastern EuropeEcuadorEgyptEl SalvadorEnglandEritreaEthiopiaEuropeFijiFranceGermanyGhanaGreeceGrenadaGuatemalaGuyanaHaitiHondurasHong KongHungaryIndiaIndonesiaIranIraqIrelandIsraelItalyJamaicaJapanJordanKazakhstanKenyaKoreaKuwaitLaosLatin AmericaLatviaLebanonLiberiaLithuaniaMalaysiaMexicoMicronesiaMiddle AfricaMoldovaMoroccoNepalNetherlandsNicaraguaNigeriaNorth AmericaNorth MacedoniaNorthern AfricaNorthern EuropeNorwayOceaniaPakistanPanamaPeruPhilippinesPolandPortugalRomaniaRussiaSaudi ArabiaScotlandSenegalSerbiaSierra LeoneSingaporeSomaliaSouth AfricaSouth AmericaSouth Central AsiaSouth Eastern AsiaSouthern EuropeSpainSri LankaSt. Vincent and the GrenadinesSudanSwedenSwitzerlandSyriaTaiwanThailandTrinidad and TobagoTurkeyUgandaUkraineUruguayUzbekistanVenezuelaVietnamWest IndiesWestern AfricaWestern AsiaWestern EuropeYemenZaireZimbabweAzores
Currently Married
Income
Poverty
Unemployment
Labor Participation
Family Structure
Vehicle Availability
Education Level
Disability

Currently Married Comparison

Slovaks

Welsh

Exceptional
Exceptional
48.3%
CURRENTLY MARRIED
98.2/ 100
METRIC RATING
67th/ 347
METRIC RANK
48.9%
CURRENTLY MARRIED
99.5/ 100
METRIC RATING
28th/ 347
METRIC RANK

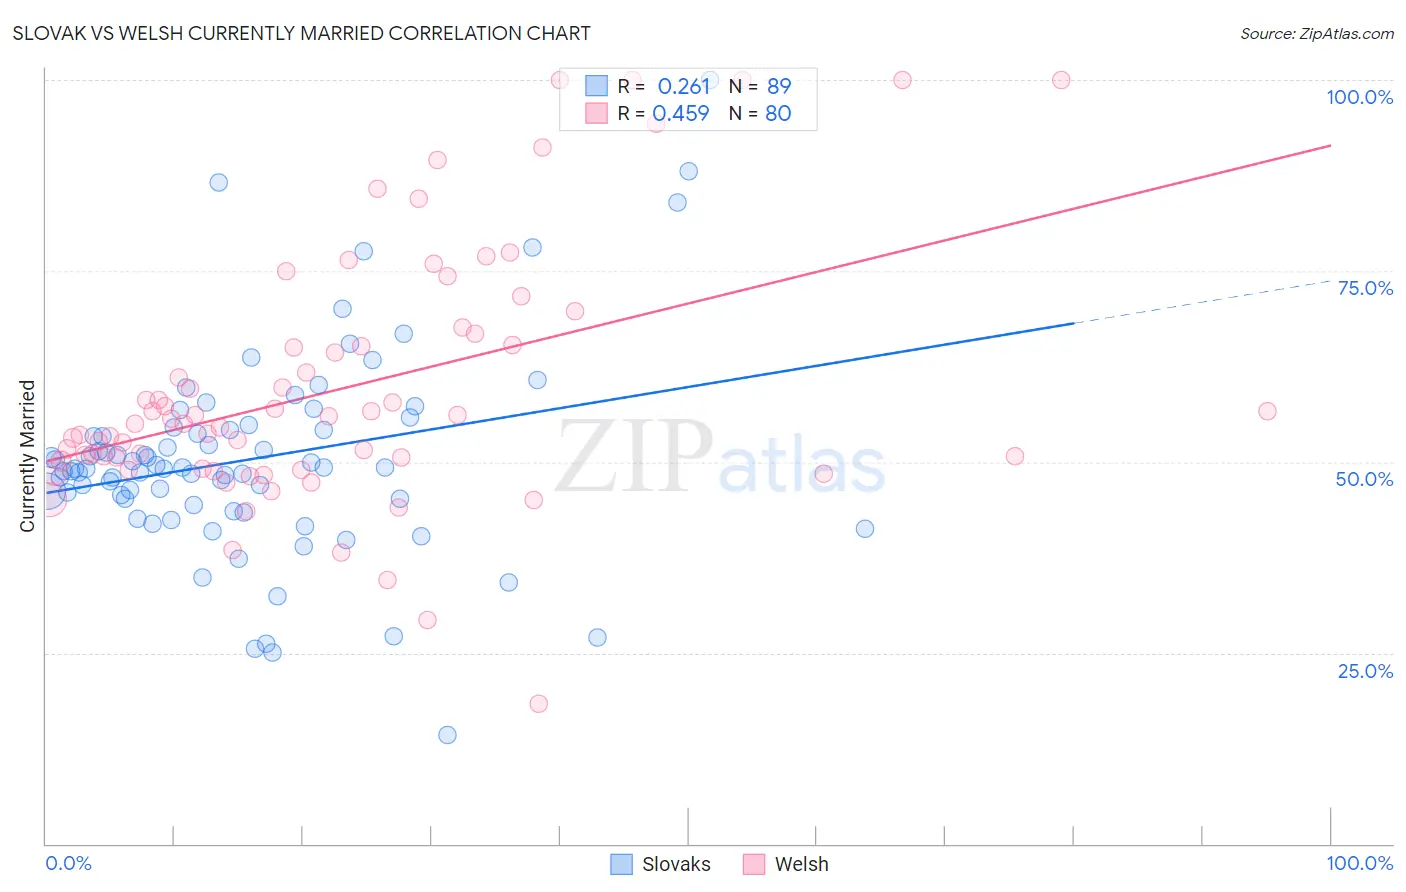
Slovak vs Welsh Currently Married Correlation Chart

The statistical analysis conducted on geographies consisting of 397,850,297 people shows a weak positive correlation between the proportion of Slovaks and percentage of population currently married in the United States with a correlation coefficient (R) of 0.261 and weighted average of 48.3%. Similarly, the statistical analysis conducted on geographies consisting of 528,516,985 people shows a moderate positive correlation between the proportion of Welsh and percentage of population currently married in the United States with a correlation coefficient (R) of 0.459 and weighted average of 48.9%, a difference of 1.2%.
Slovak vs Welsh Currently Married

Currently Married Correlation Summary

MeasurementSlovakWelsh
Minimum14.2%18.4%
Maximum100.0%100.0%
Range85.8%81.6%
Mean50.4%59.7%
Median49.2%55.4%
Interquartile 25% (IQ1)44.7%49.6%
Interquartile 75% (IQ3)54.4%66.0%
Interquartile Range (IQR)9.7%16.4%
Standard Deviation (Sample)13.5%16.8%
Standard Deviation (Population)13.5%16.7%

Similar Demographics by Currently Married

Demographics Similar to Slovaks by Currently Married

In terms of currently married, the demographic groups most similar to Slovaks are Tongan (48.3%, a difference of 0.010%), Immigrants from England (48.3%, a difference of 0.010%), Canadian (48.3%, a difference of 0.020%), Ukrainian (48.4%, a difference of 0.040%), and Slavic (48.4%, a difference of 0.050%).
DemographicsRating | RankCurrently Married
Immigrants | Romania
98.5
/100
|
#60
Exceptional
48.4%
Romanians
98.5
/100
|
#61
Exceptional
48.4%
Asians
98.5
/100
|
#62
Exceptional
48.4%
Slavs
98.3
/100
|
#63
Exceptional
48.4%
Immigrants | Czechoslovakia
98.3
/100
|
#64
Exceptional
48.4%
Ukrainians
98.3
/100
|
#65
Exceptional
48.4%
Tongans
98.2
/100
|
#66
Exceptional
48.3%
Slovaks
98.2
/100
|
#67
Exceptional
48.3%
Immigrants | England
98.2
/100
|
#68
Exceptional
48.3%
Canadians
98.1
/100
|
#69
Exceptional
48.3%
Immigrants | Asia
97.9
/100
|
#70
Exceptional
48.3%
Macedonians
97.9
/100
|
#71
Exceptional
48.3%
Immigrants | Lebanon
97.6
/100
|
#72
Exceptional
48.2%
Immigrants | Eastern Asia
97.5
/100
|
#73
Exceptional
48.2%
Estonians
97.4
/100
|
#74
Exceptional
48.2%

Demographics Similar to Welsh by Currently Married

In terms of currently married, the demographic groups most similar to Welsh are Burmese (48.9%, a difference of 0.040%), Croatian (48.9%, a difference of 0.050%), Eastern European (48.9%, a difference of 0.060%), Polish (48.9%, a difference of 0.060%), and Immigrants from Hong Kong (48.9%, a difference of 0.070%).
DemographicsRating | RankCurrently Married
Scottish
99.8
/100
|
#21
Exceptional
49.2%
Bulgarians
99.7
/100
|
#22
Exceptional
49.1%
Immigrants | Pakistan
99.7
/100
|
#23
Exceptional
49.1%
Lithuanians
99.6
/100
|
#24
Exceptional
49.0%
Maltese
99.6
/100
|
#25
Exceptional
49.0%
Immigrants | Korea
99.6
/100
|
#26
Exceptional
49.0%
Burmese
99.6
/100
|
#27
Exceptional
48.9%
Welsh
99.5
/100
|
#28
Exceptional
48.9%
Croatians
99.5
/100
|
#29
Exceptional
48.9%
Eastern Europeans
99.5
/100
|
#30
Exceptional
48.9%
Poles
99.5
/100
|
#31
Exceptional
48.9%
Immigrants | Hong Kong
99.5
/100
|
#32
Exceptional
48.9%
Irish
99.5
/100
|
#33
Exceptional
48.9%
Immigrants | Lithuania
99.4
/100
|
#34
Exceptional
48.8%
Immigrants | Northern Europe
99.4
/100
|
#35
Exceptional
48.8%