American vs Swiss 2 or more Vehicles in Household
COMPARE
American
Swiss
2 or more Vehicles in Household
2 or more Vehicles in Household Comparison
Americans
Swiss
60.0%
2 OR MORE VEHICLES IN HOUSEHOLD
100.0/ 100
METRIC RATING
38th/ 347
METRIC RANK
61.0%
2 OR MORE VEHICLES IN HOUSEHOLD
100.0/ 100
METRIC RATING
22nd/ 347
METRIC RANK
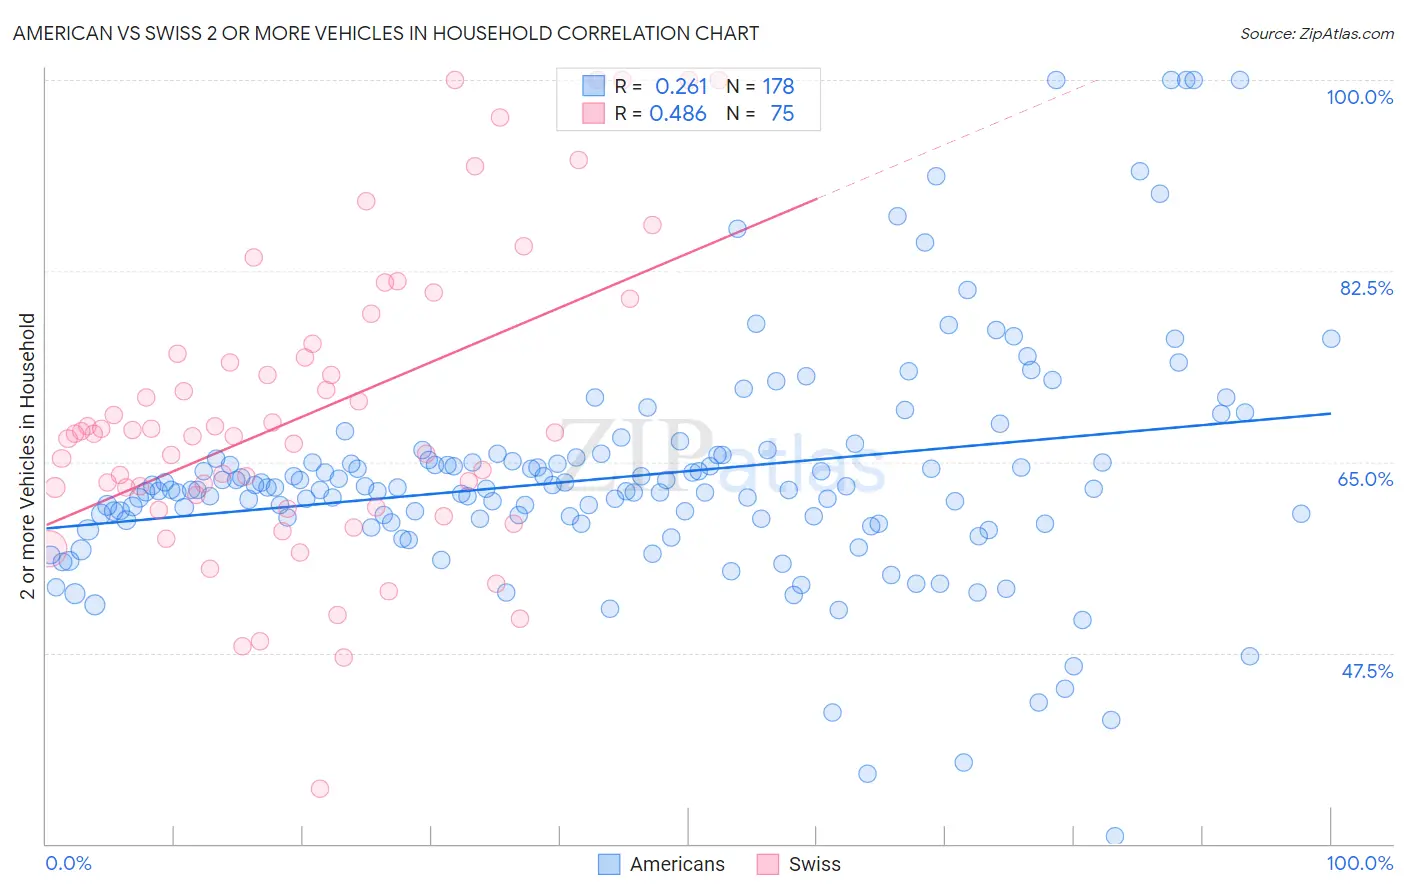
American vs Swiss 2 or more Vehicles in Household Correlation Chart
The statistical analysis conducted on geographies consisting of 581,432,617 people shows a weak positive correlation between the proportion of Americans and percentage of households with 2 or more vehicles available in the United States with a correlation coefficient (R) of 0.261 and weighted average of 60.0%. Similarly, the statistical analysis conducted on geographies consisting of 464,799,641 people shows a moderate positive correlation between the proportion of Swiss and percentage of households with 2 or more vehicles available in the United States with a correlation coefficient (R) of 0.486 and weighted average of 61.0%, a difference of 1.5%.
2 or more Vehicles in Household Correlation Summary
| Measurement | American | Swiss |
| Minimum | 30.7% | 35.0% |
| Maximum | 100.0% | 100.0% |
| Range | 69.3% | 65.0% |
| Mean | 63.6% | 69.3% |
| Median | 62.5% | 67.5% |
| Interquartile 25% (IQ1) | 59.7% | 60.8% |
| Interquartile 75% (IQ3) | 65.2% | 75.0% |
| Interquartile Range (IQR) | 5.6% | 14.2% |
| Standard Deviation (Sample) | 10.7% | 13.7% |
| Standard Deviation (Population) | 10.7% | 13.6% |
Demographics Similar to Americans and Swiss by 2 or more Vehicles in Household
In terms of 2 or more vehicles in household, the demographic groups most similar to Americans are British (60.0%, a difference of 0.0%), Irish (60.1%, a difference of 0.060%), Chinese (60.1%, a difference of 0.10%), Immigrants from Philippines (60.1%, a difference of 0.12%), and Spanish (60.2%, a difference of 0.24%). Similarly, the demographic groups most similar to Swiss are Korean (61.0%, a difference of 0.040%), Scotch-Irish (60.9%, a difference of 0.040%), Immigrants from Vietnam (60.9%, a difference of 0.070%), Sri Lankan (61.0%, a difference of 0.080%), and White/Caucasian (60.8%, a difference of 0.23%).
| Demographics | Rating | Rank | 2 or more Vehicles in Household |
| Sri Lankans | 100.0 /100 | #20 | Exceptional 61.0% |
| Koreans | 100.0 /100 | #21 | Exceptional 61.0% |
| Swiss | 100.0 /100 | #22 | Exceptional 61.0% |
| Scotch-Irish | 100.0 /100 | #23 | Exceptional 60.9% |
| Immigrants | Vietnam | 100.0 /100 | #24 | Exceptional 60.9% |
| Whites/Caucasians | 100.0 /100 | #25 | Exceptional 60.8% |
| Welsh | 100.0 /100 | #26 | Exceptional 60.8% |
| Assyrians/Chaldeans/Syriacs | 100.0 /100 | #27 | Exceptional 60.5% |
| Guamanians/Chamorros | 100.0 /100 | #28 | Exceptional 60.5% |
| Hawaiians | 100.0 /100 | #29 | Exceptional 60.4% |
| Finns | 100.0 /100 | #30 | Exceptional 60.3% |
| Spanish American Indians | 100.0 /100 | #31 | Exceptional 60.3% |
| Arapaho | 100.0 /100 | #32 | Exceptional 60.2% |
| Immigrants | Mexico | 100.0 /100 | #33 | Exceptional 60.2% |
| Spanish | 100.0 /100 | #34 | Exceptional 60.2% |
| Immigrants | Philippines | 100.0 /100 | #35 | Exceptional 60.1% |
| Chinese | 100.0 /100 | #36 | Exceptional 60.1% |
| Irish | 100.0 /100 | #37 | Exceptional 60.1% |
| Americans | 100.0 /100 | #38 | Exceptional 60.0% |
| British | 100.0 /100 | #39 | Exceptional 60.0% |
| Cherokee | 100.0 /100 | #40 | Exceptional 59.9% |