Sioux vs Swiss Cognitive Disability
COMPARE
Sioux
Swiss
Cognitive Disability
Cognitive Disability Comparison
Sioux
Swiss
17.3%
COGNITIVE DISABILITY
48.6/ 100
METRIC RATING
179th/ 347
METRIC RANK
16.7%
COGNITIVE DISABILITY
99.2/ 100
METRIC RATING
82nd/ 347
METRIC RANK
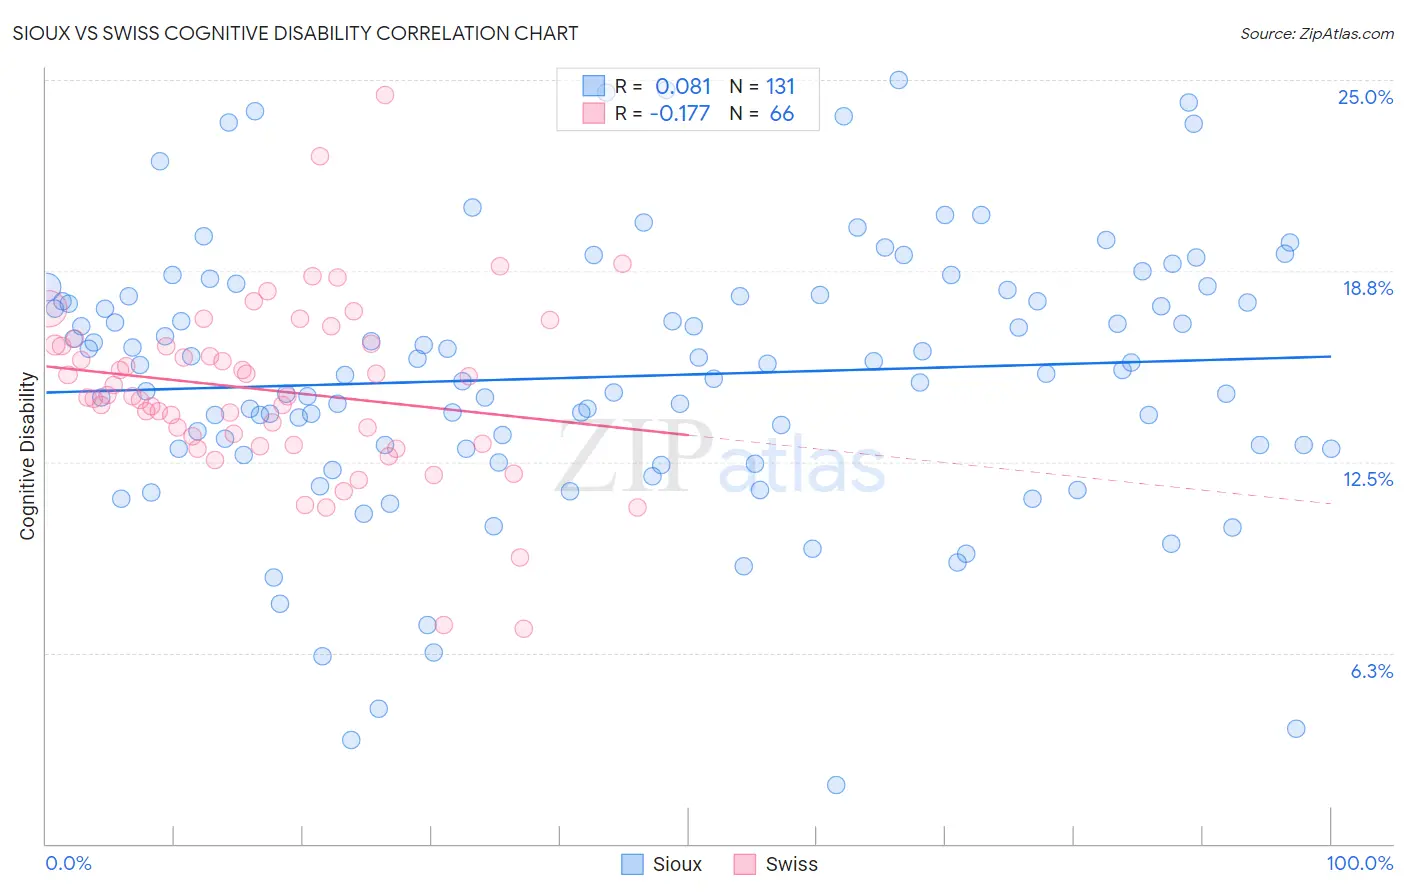
Sioux vs Swiss Cognitive Disability Correlation Chart
The statistical analysis conducted on geographies consisting of 234,153,820 people shows a slight positive correlation between the proportion of Sioux and percentage of population with cognitive disability in the United States with a correlation coefficient (R) of 0.081 and weighted average of 17.3%. Similarly, the statistical analysis conducted on geographies consisting of 464,991,468 people shows a poor negative correlation between the proportion of Swiss and percentage of population with cognitive disability in the United States with a correlation coefficient (R) of -0.177 and weighted average of 16.7%, a difference of 3.6%.
Cognitive Disability Correlation Summary
| Measurement | Sioux | Swiss |
| Minimum | 1.9% | 7.0% |
| Maximum | 25.0% | 24.5% |
| Range | 23.1% | 17.5% |
| Mean | 15.3% | 14.8% |
| Median | 15.5% | 14.6% |
| Interquartile 25% (IQ1) | 12.9% | 13.1% |
| Interquartile 75% (IQ3) | 17.9% | 16.3% |
| Interquartile Range (IQR) | 5.0% | 3.2% |
| Standard Deviation (Sample) | 4.4% | 2.9% |
| Standard Deviation (Population) | 4.4% | 2.9% |
Similar Demographics by Cognitive Disability
Demographics Similar to Sioux by Cognitive Disability
In terms of cognitive disability, the demographic groups most similar to Sioux are Ute (17.3%, a difference of 0.010%), Spanish (17.3%, a difference of 0.010%), Shoshone (17.3%, a difference of 0.020%), Tsimshian (17.3%, a difference of 0.030%), and Laotian (17.3%, a difference of 0.040%).
| Demographics | Rating | Rank | Cognitive Disability |
| Immigrants | Turkey | 56.7 /100 | #172 | Average 17.2% |
| Immigrants | Northern Africa | 50.2 /100 | #173 | Average 17.3% |
| Laotians | 50.0 /100 | #174 | Average 17.3% |
| Tsimshian | 49.8 /100 | #175 | Average 17.3% |
| Shoshone | 49.2 /100 | #176 | Average 17.3% |
| Ute | 49.1 /100 | #177 | Average 17.3% |
| Spanish | 48.9 /100 | #178 | Average 17.3% |
| Sioux | 48.6 /100 | #179 | Average 17.3% |
| Pakistanis | 43.9 /100 | #180 | Average 17.3% |
| Immigrants | Guyana | 42.9 /100 | #181 | Average 17.3% |
| Arabs | 42.8 /100 | #182 | Average 17.3% |
| Spaniards | 40.3 /100 | #183 | Average 17.3% |
| Crow | 39.1 /100 | #184 | Fair 17.3% |
| Afghans | 38.2 /100 | #185 | Fair 17.3% |
| Cambodians | 35.9 /100 | #186 | Fair 17.3% |
Demographics Similar to Swiss by Cognitive Disability
In terms of cognitive disability, the demographic groups most similar to Swiss are Immigrants from Netherlands (16.7%, a difference of 0.030%), Egyptian (16.7%, a difference of 0.040%), Immigrants from Bulgaria (16.7%, a difference of 0.060%), Peruvian (16.7%, a difference of 0.070%), and Serbian (16.7%, a difference of 0.070%).
| Demographics | Rating | Rank | Cognitive Disability |
| Estonians | 99.3 /100 | #75 | Exceptional 16.7% |
| Immigrants | Serbia | 99.3 /100 | #76 | Exceptional 16.7% |
| Immigrants | Hungary | 99.3 /100 | #77 | Exceptional 16.7% |
| Peruvians | 99.3 /100 | #78 | Exceptional 16.7% |
| Immigrants | Bulgaria | 99.3 /100 | #79 | Exceptional 16.7% |
| Egyptians | 99.2 /100 | #80 | Exceptional 16.7% |
| Immigrants | Netherlands | 99.2 /100 | #81 | Exceptional 16.7% |
| Swiss | 99.2 /100 | #82 | Exceptional 16.7% |
| Serbians | 99.1 /100 | #83 | Exceptional 16.7% |
| Belgians | 99.1 /100 | #84 | Exceptional 16.7% |
| Immigrants | Moldova | 99.1 /100 | #85 | Exceptional 16.7% |
| Immigrants | South Africa | 99.0 /100 | #86 | Exceptional 16.7% |
| Native Hawaiians | 99.0 /100 | #87 | Exceptional 16.7% |
| Immigrants | Philippines | 99.0 /100 | #88 | Exceptional 16.7% |
| Immigrants | Egypt | 98.8 /100 | #89 | Exceptional 16.7% |