Sioux vs Fijian Child Poverty Under the Age of 5
COMPARE
Sioux
Fijian
Child Poverty Under the Age of 5
Child Poverty Under the Age of 5 Comparison
Sioux
Fijians
26.9%
CHILD POVERTY UNDER THE AGE OF 5
0.0/ 100
METRIC RATING
336th/ 347
METRIC RANK
19.9%
CHILD POVERTY UNDER THE AGE OF 5
0.3/ 100
METRIC RATING
254th/ 347
METRIC RANK
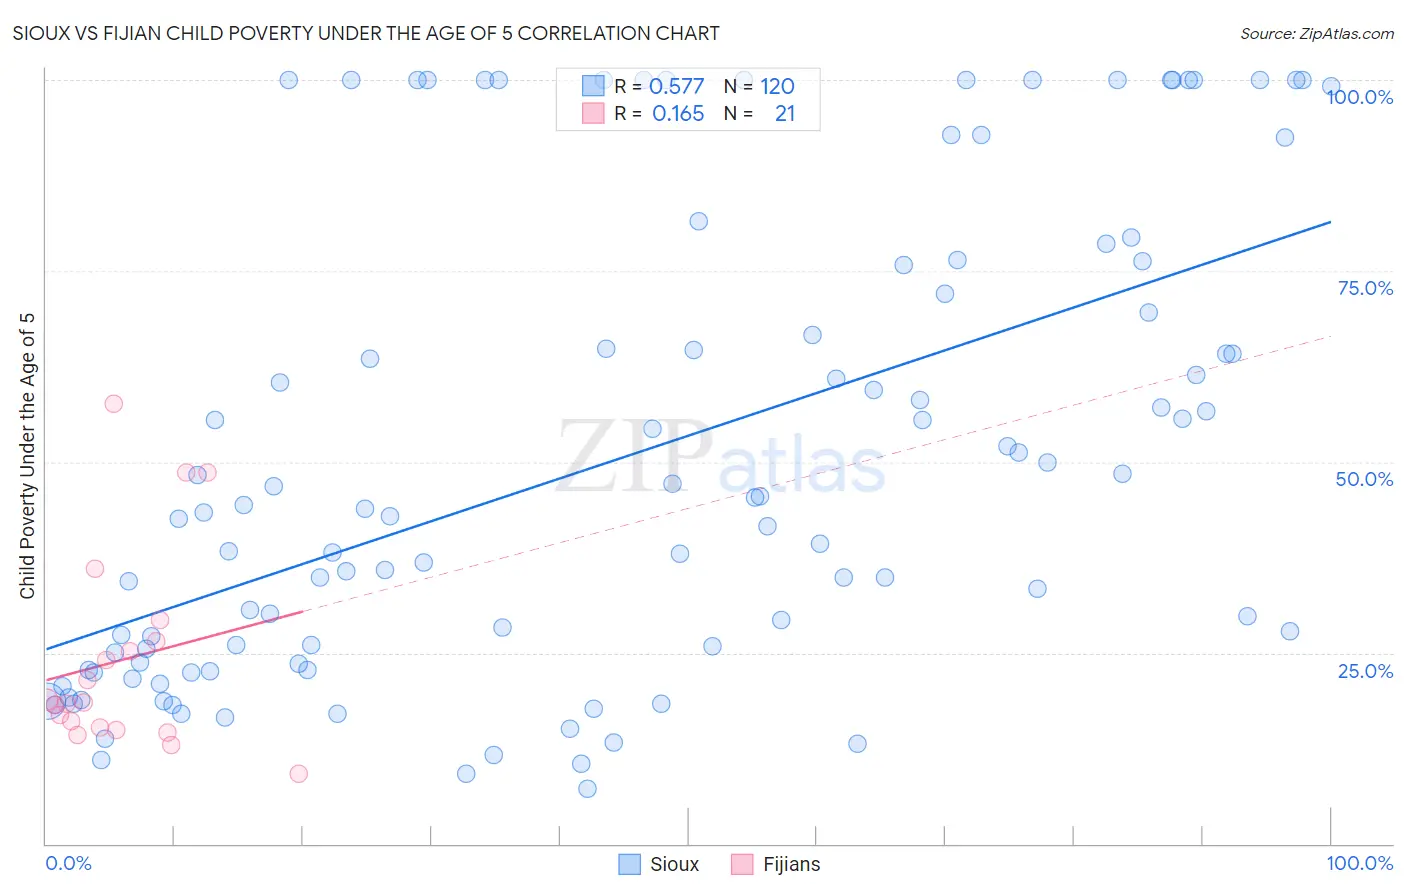
Sioux vs Fijian Child Poverty Under the Age of 5 Correlation Chart
The statistical analysis conducted on geographies consisting of 228,915,867 people shows a substantial positive correlation between the proportion of Sioux and poverty level among children under the age of 5 in the United States with a correlation coefficient (R) of 0.577 and weighted average of 26.9%. Similarly, the statistical analysis conducted on geographies consisting of 55,648,534 people shows a poor positive correlation between the proportion of Fijians and poverty level among children under the age of 5 in the United States with a correlation coefficient (R) of 0.165 and weighted average of 19.9%, a difference of 35.3%.
Child Poverty Under the Age of 5 Correlation Summary
| Measurement | Sioux | Fijian |
| Minimum | 7.1% | 9.1% |
| Maximum | 100.0% | 57.7% |
| Range | 92.9% | 48.6% |
| Mean | 50.3% | 24.1% |
| Median | 43.6% | 18.5% |
| Interquartile 25% (IQ1) | 23.7% | 15.1% |
| Interquartile 75% (IQ3) | 73.9% | 27.9% |
| Interquartile Range (IQR) | 50.3% | 12.8% |
| Standard Deviation (Sample) | 30.1% | 13.1% |
| Standard Deviation (Population) | 30.0% | 12.8% |
Similar Demographics by Child Poverty Under the Age of 5
Demographics Similar to Sioux by Child Poverty Under the Age of 5
In terms of child poverty under the age of 5, the demographic groups most similar to Sioux are Pima (27.4%, a difference of 1.9%), Hopi (27.7%, a difference of 2.9%), Yup'ik (27.7%, a difference of 3.0%), Black/African American (25.7%, a difference of 4.9%), and Colville (25.7%, a difference of 4.9%).
| Demographics | Rating | Rank | Child Poverty Under the Age of 5 |
| Cajuns | 0.0 /100 | #329 | Tragic 24.1% |
| Creek | 0.0 /100 | #330 | Tragic 24.2% |
| Kiowa | 0.0 /100 | #331 | Tragic 24.5% |
| Apache | 0.0 /100 | #332 | Tragic 25.0% |
| Natives/Alaskans | 0.0 /100 | #333 | Tragic 25.6% |
| Blacks/African Americans | 0.0 /100 | #334 | Tragic 25.7% |
| Colville | 0.0 /100 | #335 | Tragic 25.7% |
| Sioux | 0.0 /100 | #336 | Tragic 26.9% |
| Pima | 0.0 /100 | #337 | Tragic 27.4% |
| Hopi | 0.0 /100 | #338 | Tragic 27.7% |
| Yup'ik | 0.0 /100 | #339 | Tragic 27.7% |
| Cheyenne | 0.0 /100 | #340 | Tragic 28.3% |
| Immigrants | Yemen | 0.0 /100 | #341 | Tragic 29.3% |
| Tohono O'odham | 0.0 /100 | #342 | Tragic 29.5% |
| Yuman | 0.0 /100 | #343 | Tragic 29.5% |
Demographics Similar to Fijians by Child Poverty Under the Age of 5
In terms of child poverty under the age of 5, the demographic groups most similar to Fijians are Immigrants from Cuba (19.9%, a difference of 0.10%), Mexican American Indian (19.9%, a difference of 0.15%), Immigrants from Barbados (20.0%, a difference of 0.32%), Shoshone (20.0%, a difference of 0.33%), and Immigrants from St. Vincent and the Grenadines (20.0%, a difference of 0.47%).
| Demographics | Rating | Rank | Child Poverty Under the Age of 5 |
| Guyanese | 0.4 /100 | #247 | Tragic 19.7% |
| Marshallese | 0.4 /100 | #248 | Tragic 19.7% |
| Immigrants | Middle Africa | 0.4 /100 | #249 | Tragic 19.7% |
| Immigrants | Nonimmigrants | 0.4 /100 | #250 | Tragic 19.7% |
| Pennsylvania Germans | 0.3 /100 | #251 | Tragic 19.8% |
| Immigrants | Nicaragua | 0.3 /100 | #252 | Tragic 19.8% |
| Mexican American Indians | 0.3 /100 | #253 | Tragic 19.9% |
| Fijians | 0.3 /100 | #254 | Tragic 19.9% |
| Immigrants | Cuba | 0.2 /100 | #255 | Tragic 19.9% |
| Immigrants | Barbados | 0.2 /100 | #256 | Tragic 20.0% |
| Shoshone | 0.2 /100 | #257 | Tragic 20.0% |
| Immigrants | St. Vincent and the Grenadines | 0.2 /100 | #258 | Tragic 20.0% |
| Immigrants | El Salvador | 0.2 /100 | #259 | Tragic 20.0% |
| Spanish Americans | 0.2 /100 | #260 | Tragic 20.1% |
| Immigrants | Bangladesh | 0.2 /100 | #261 | Tragic 20.1% |