German vs Sudanese 1 or more Vehicles in Household
COMPARE
German
Sudanese
1 or more Vehicles in Household
1 or more Vehicles in Household Comparison
Germans
Sudanese
93.6%
1 OR MORE VEHICLES IN HOUSEHOLD
100.0/ 100
METRIC RATING
4th/ 347
METRIC RANK
90.3%
1 OR MORE VEHICLES IN HOUSEHOLD
85.2/ 100
METRIC RATING
140th/ 347
METRIC RANK
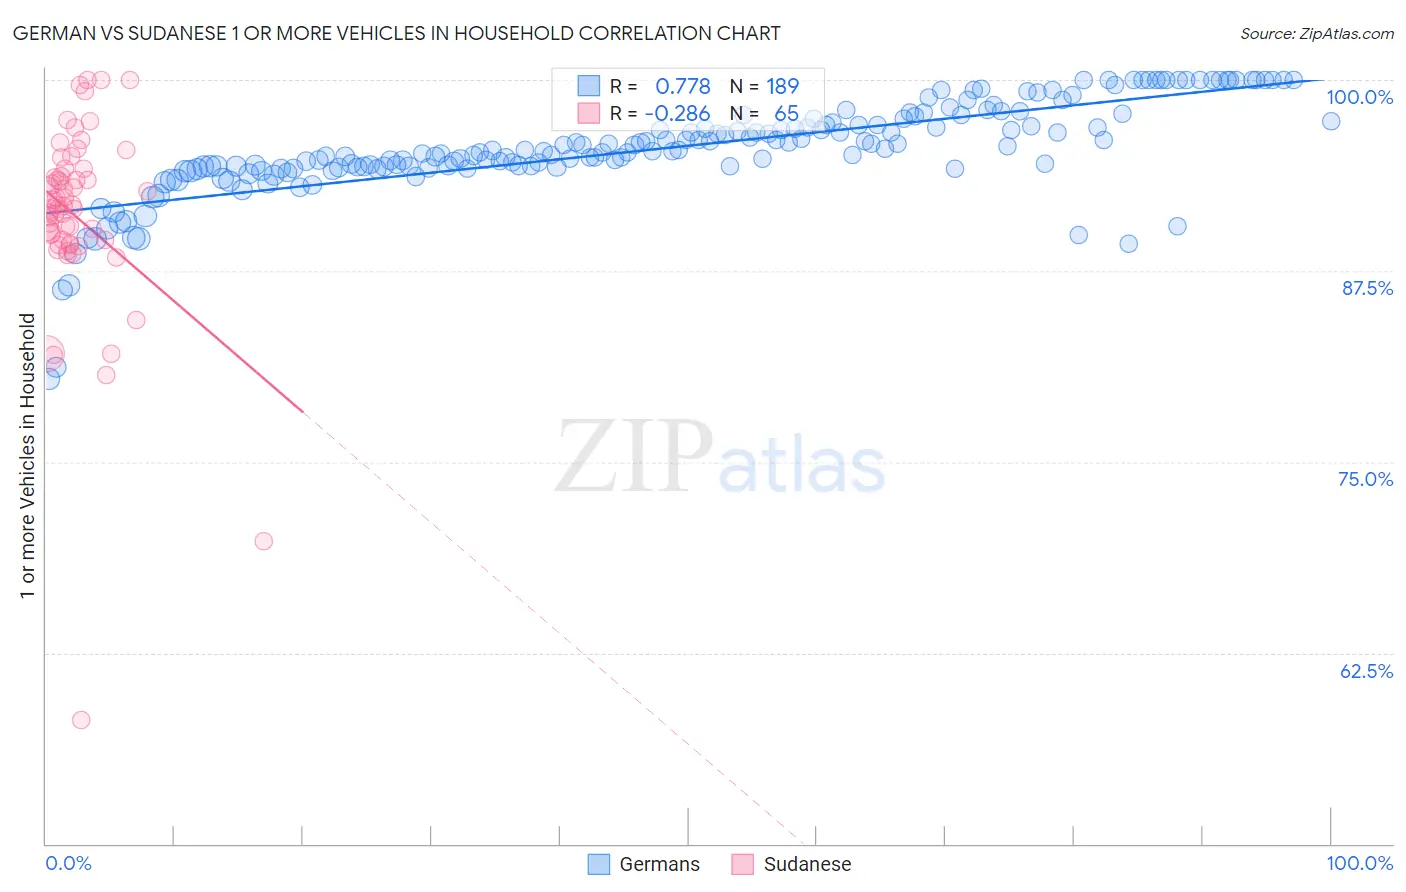
German vs Sudanese 1 or more Vehicles in Household Correlation Chart
The statistical analysis conducted on geographies consisting of 561,083,336 people shows a strong positive correlation between the proportion of Germans and percentage of households with 1 or more vehicles available in the United States with a correlation coefficient (R) of 0.778 and weighted average of 93.6%. Similarly, the statistical analysis conducted on geographies consisting of 110,123,391 people shows a weak negative correlation between the proportion of Sudanese and percentage of households with 1 or more vehicles available in the United States with a correlation coefficient (R) of -0.286 and weighted average of 90.3%, a difference of 3.7%.
1 or more Vehicles in Household Correlation Summary
| Measurement | German | Sudanese |
| Minimum | 80.4% | 58.1% |
| Maximum | 100.0% | 100.0% |
| Range | 19.6% | 41.9% |
| Mean | 95.5% | 91.1% |
| Median | 95.4% | 91.7% |
| Interquartile 25% (IQ1) | 94.3% | 89.4% |
| Interquartile 75% (IQ3) | 97.4% | 93.9% |
| Interquartile Range (IQR) | 3.1% | 4.5% |
| Standard Deviation (Sample) | 3.1% | 6.5% |
| Standard Deviation (Population) | 3.1% | 6.4% |
Similar Demographics by 1 or more Vehicles in Household
Demographics Similar to Germans by 1 or more Vehicles in Household
In terms of 1 or more vehicles in household, the demographic groups most similar to Germans are Norwegian (93.7%, a difference of 0.050%), Yakama (93.6%, a difference of 0.10%), Danish (93.5%, a difference of 0.12%), English (93.8%, a difference of 0.17%), and Scottish (93.4%, a difference of 0.30%).
| Demographics | Rating | Rank | 1 or more Vehicles in Household |
| Luxembourgers | 100.0 /100 | #1 | Exceptional 94.8% |
| English | 100.0 /100 | #2 | Exceptional 93.8% |
| Norwegians | 100.0 /100 | #3 | Exceptional 93.7% |
| Germans | 100.0 /100 | #4 | Exceptional 93.6% |
| Yakama | 100.0 /100 | #5 | Exceptional 93.6% |
| Danes | 100.0 /100 | #6 | Exceptional 93.5% |
| Scottish | 100.0 /100 | #7 | Exceptional 93.4% |
| Swedes | 100.0 /100 | #8 | Exceptional 93.3% |
| Scotch-Irish | 100.0 /100 | #9 | Exceptional 93.3% |
| Dutch | 100.0 /100 | #10 | Exceptional 93.3% |
| Czechs | 100.0 /100 | #11 | Exceptional 93.3% |
| Scandinavians | 100.0 /100 | #12 | Exceptional 93.1% |
| Whites/Caucasians | 100.0 /100 | #13 | Exceptional 93.1% |
| Irish | 100.0 /100 | #14 | Exceptional 93.1% |
| Mexicans | 100.0 /100 | #15 | Exceptional 93.0% |
Demographics Similar to Sudanese by 1 or more Vehicles in Household
In terms of 1 or more vehicles in household, the demographic groups most similar to Sudanese are Estonian (90.3%, a difference of 0.010%), Latvian (90.3%, a difference of 0.030%), Syrian (90.3%, a difference of 0.030%), Hungarian (90.3%, a difference of 0.040%), and Kenyan (90.4%, a difference of 0.060%).
| Demographics | Rating | Rank | 1 or more Vehicles in Household |
| Immigrants | Syria | 87.5 /100 | #133 | Excellent 90.4% |
| Kenyans | 87.0 /100 | #134 | Excellent 90.4% |
| Immigrants | Oceania | 86.9 /100 | #135 | Excellent 90.4% |
| Hungarians | 86.5 /100 | #136 | Excellent 90.3% |
| Latvians | 86.3 /100 | #137 | Excellent 90.3% |
| Syrians | 86.3 /100 | #138 | Excellent 90.3% |
| Estonians | 85.6 /100 | #139 | Excellent 90.3% |
| Sudanese | 85.2 /100 | #140 | Excellent 90.3% |
| Immigrants | Moldova | 83.1 /100 | #141 | Excellent 90.2% |
| Immigrants | Lithuania | 83.0 /100 | #142 | Excellent 90.2% |
| Immigrants | Bahamas | 81.5 /100 | #143 | Excellent 90.2% |
| Immigrants | Zimbabwe | 81.5 /100 | #144 | Excellent 90.2% |
| Sioux | 81.3 /100 | #145 | Excellent 90.2% |
| Bahamians | 80.5 /100 | #146 | Excellent 90.2% |
| Chileans | 79.8 /100 | #147 | Good 90.2% |