Immigrants from Ecuador vs Iraqi 2 or more Vehicles in Household
COMPARE
Immigrants from Ecuador
Iraqi
2 or more Vehicles in Household
2 or more Vehicles in Household Comparison
Immigrants from Ecuador
Iraqis
40.5%
2 OR MORE VEHICLES IN HOUSEHOLD
0.0/ 100
METRIC RATING
333rd/ 347
METRIC RANK
57.1%
2 OR MORE VEHICLES IN HOUSEHOLD
95.8/ 100
METRIC RATING
117th/ 347
METRIC RANK
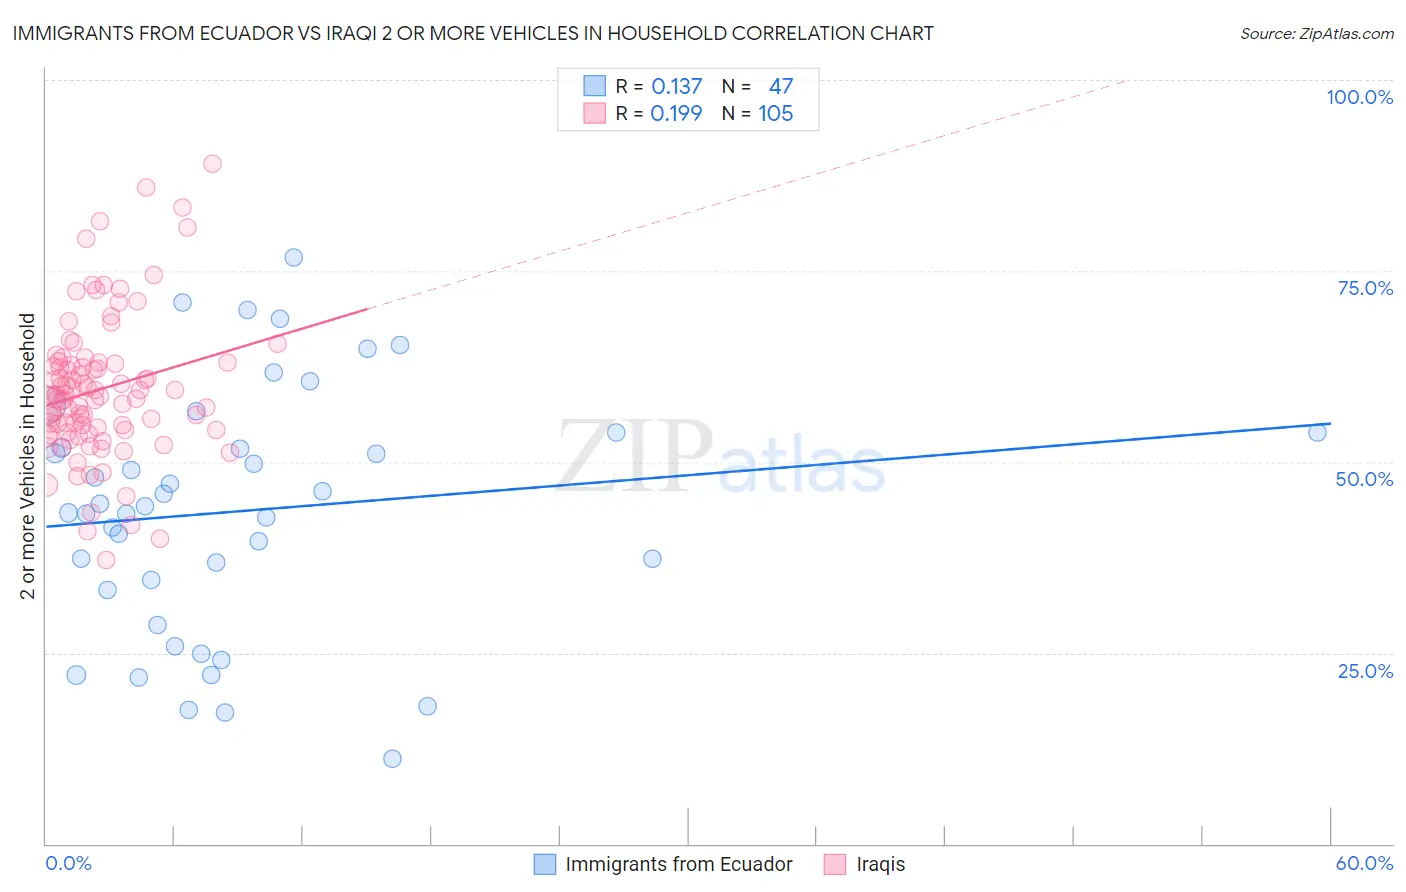
Immigrants from Ecuador vs Iraqi 2 or more Vehicles in Household Correlation Chart
The statistical analysis conducted on geographies consisting of 270,900,230 people shows a poor positive correlation between the proportion of Immigrants from Ecuador and percentage of households with 2 or more vehicles available in the United States with a correlation coefficient (R) of 0.137 and weighted average of 40.5%. Similarly, the statistical analysis conducted on geographies consisting of 170,650,465 people shows a poor positive correlation between the proportion of Iraqis and percentage of households with 2 or more vehicles available in the United States with a correlation coefficient (R) of 0.199 and weighted average of 57.1%, a difference of 40.9%.
2 or more Vehicles in Household Correlation Summary
| Measurement | Immigrants from Ecuador | Iraqi |
| Minimum | 11.1% | 37.2% |
| Maximum | 76.8% | 89.1% |
| Range | 65.7% | 51.9% |
| Mean | 43.6% | 59.5% |
| Median | 44.2% | 58.7% |
| Interquartile 25% (IQ1) | 33.2% | 54.1% |
| Interquartile 75% (IQ3) | 53.8% | 62.9% |
| Interquartile Range (IQR) | 20.6% | 8.7% |
| Standard Deviation (Sample) | 16.0% | 9.3% |
| Standard Deviation (Population) | 15.8% | 9.3% |
Similar Demographics by 2 or more Vehicles in Household
Demographics Similar to Immigrants from Ecuador by 2 or more Vehicles in Household
In terms of 2 or more vehicles in household, the demographic groups most similar to Immigrants from Ecuador are Immigrants from Trinidad and Tobago (40.3%, a difference of 0.58%), Trinidadian and Tobagonian (40.9%, a difference of 0.92%), West Indian (41.3%, a difference of 1.9%), Immigrants from Dominica (41.6%, a difference of 2.8%), and Ecuadorian (42.0%, a difference of 3.6%).
| Demographics | Rating | Rank | 2 or more Vehicles in Household |
| Immigrants | Senegal | 0.0 /100 | #326 | Tragic 43.0% |
| Immigrants | Yemen | 0.0 /100 | #327 | Tragic 42.8% |
| Inupiat | 0.0 /100 | #328 | Tragic 42.6% |
| Ecuadorians | 0.0 /100 | #329 | Tragic 42.0% |
| Immigrants | Dominica | 0.0 /100 | #330 | Tragic 41.6% |
| West Indians | 0.0 /100 | #331 | Tragic 41.3% |
| Trinidadians and Tobagonians | 0.0 /100 | #332 | Tragic 40.9% |
| Immigrants | Ecuador | 0.0 /100 | #333 | Tragic 40.5% |
| Immigrants | Trinidad and Tobago | 0.0 /100 | #334 | Tragic 40.3% |
| Immigrants | Bangladesh | 0.0 /100 | #335 | Tragic 38.8% |
| Vietnamese | 0.0 /100 | #336 | Tragic 38.5% |
| Barbadians | 0.0 /100 | #337 | Tragic 38.3% |
| Immigrants | Uzbekistan | 0.0 /100 | #338 | Tragic 37.9% |
| Immigrants | Barbados | 0.0 /100 | #339 | Tragic 35.8% |
| British West Indians | 0.0 /100 | #340 | Tragic 35.4% |
Demographics Similar to Iraqis by 2 or more Vehicles in Household
In terms of 2 or more vehicles in household, the demographic groups most similar to Iraqis are Asian (57.0%, a difference of 0.16%), Immigrants from Jordan (57.2%, a difference of 0.19%), Native/Alaskan (57.0%, a difference of 0.19%), Chippewa (57.2%, a difference of 0.20%), and Costa Rican (56.9%, a difference of 0.24%).
| Demographics | Rating | Rank | 2 or more Vehicles in Household |
| Japanese | 98.0 /100 | #110 | Exceptional 57.5% |
| Greeks | 98.0 /100 | #111 | Exceptional 57.5% |
| Pueblo | 98.0 /100 | #112 | Exceptional 57.5% |
| Zimbabweans | 96.9 /100 | #113 | Exceptional 57.2% |
| Immigrants | Lebanon | 96.8 /100 | #114 | Exceptional 57.2% |
| Chippewa | 96.6 /100 | #115 | Exceptional 57.2% |
| Immigrants | Jordan | 96.6 /100 | #116 | Exceptional 57.2% |
| Iraqis | 95.8 /100 | #117 | Exceptional 57.1% |
| Asians | 95.1 /100 | #118 | Exceptional 57.0% |
| Natives/Alaskans | 95.0 /100 | #119 | Exceptional 57.0% |
| Costa Ricans | 94.7 /100 | #120 | Exceptional 56.9% |
| Sioux | 93.8 /100 | #121 | Exceptional 56.8% |
| Immigrants | South Africa | 92.5 /100 | #122 | Exceptional 56.7% |
| Australians | 91.8 /100 | #123 | Exceptional 56.7% |
| New Zealanders | 91.8 /100 | #124 | Exceptional 56.7% |