Scottish vs Immigrants from Ethiopia 4 or more Vehicles in Household
COMPARE
Scottish
Immigrants from Ethiopia
4 or more Vehicles in Household
4 or more Vehicles in Household Comparison
Scottish
Immigrants from Ethiopia
7.4%
4 OR MORE VEHICLES IN HOUSEHOLD
99.9/ 100
METRIC RATING
70th/ 347
METRIC RANK
5.7%
4 OR MORE VEHICLES IN HOUSEHOLD
2.4/ 100
METRIC RATING
247th/ 347
METRIC RANK
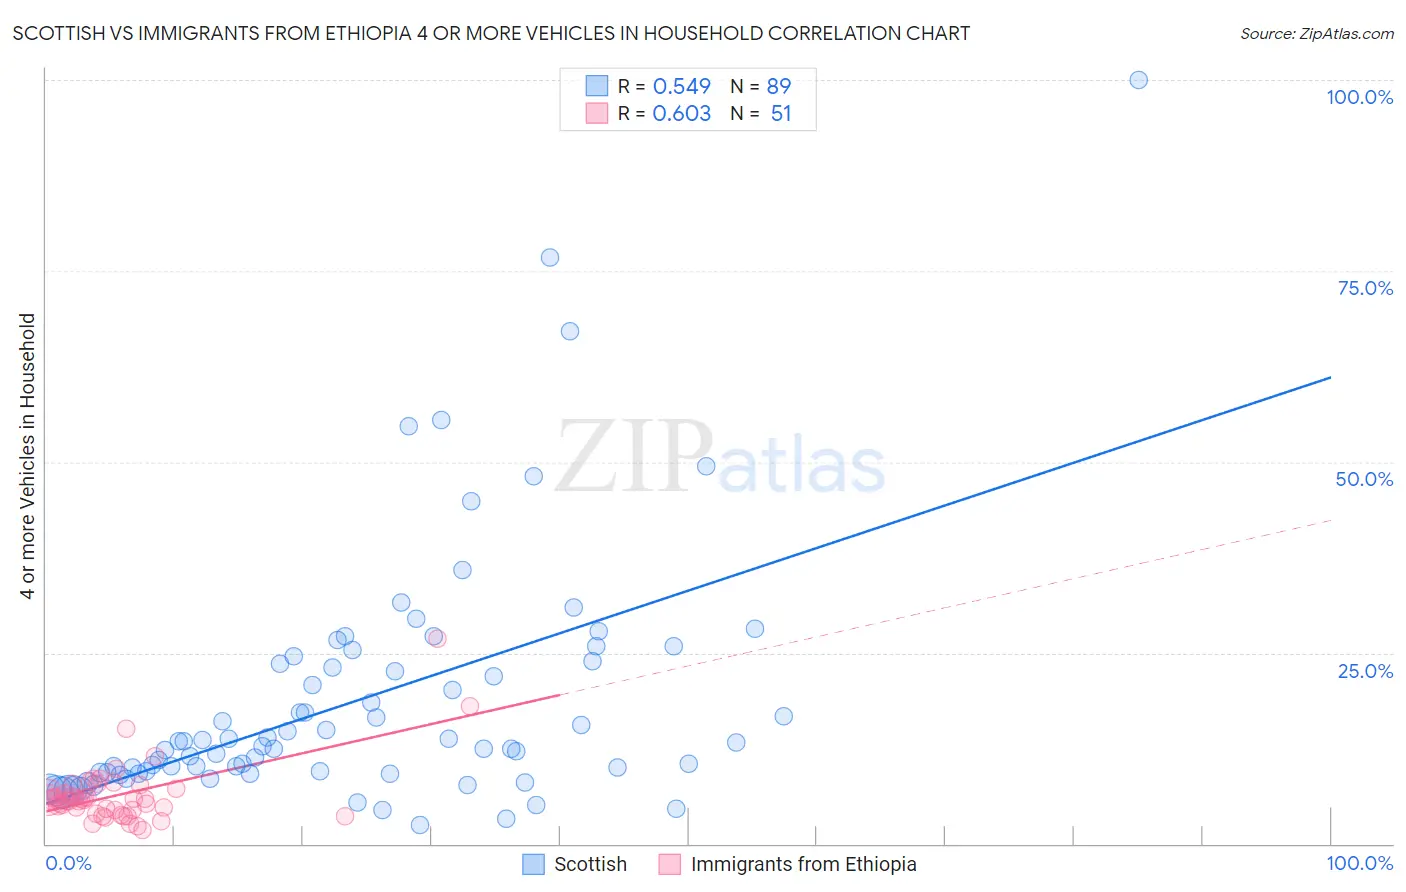
Scottish vs Immigrants from Ethiopia 4 or more Vehicles in Household Correlation Chart
The statistical analysis conducted on geographies consisting of 563,736,274 people shows a substantial positive correlation between the proportion of Scottish and percentage of households with 4 or more vehicles available in the United States with a correlation coefficient (R) of 0.549 and weighted average of 7.4%. Similarly, the statistical analysis conducted on geographies consisting of 210,800,078 people shows a significant positive correlation between the proportion of Immigrants from Ethiopia and percentage of households with 4 or more vehicles available in the United States with a correlation coefficient (R) of 0.603 and weighted average of 5.7%, a difference of 29.8%.
4 or more Vehicles in Household Correlation Summary
| Measurement | Scottish | Immigrants from Ethiopia |
| Minimum | 2.5% | 1.8% |
| Maximum | 100.0% | 26.8% |
| Range | 97.5% | 24.9% |
| Mean | 18.7% | 6.4% |
| Median | 12.8% | 5.8% |
| Interquartile 25% (IQ1) | 9.3% | 4.5% |
| Interquartile 75% (IQ3) | 23.8% | 7.2% |
| Interquartile Range (IQR) | 14.5% | 2.7% |
| Standard Deviation (Sample) | 16.4% | 4.1% |
| Standard Deviation (Population) | 16.3% | 4.1% |
Similar Demographics by 4 or more Vehicles in Household
Demographics Similar to Scottish by 4 or more Vehicles in Household
In terms of 4 or more vehicles in household, the demographic groups most similar to Scottish are German (7.5%, a difference of 0.070%), Chickasaw (7.4%, a difference of 0.13%), Scotch-Irish (7.4%, a difference of 0.43%), Portuguese (7.4%, a difference of 0.52%), and Welsh (7.5%, a difference of 0.67%).
| Demographics | Rating | Rank | 4 or more Vehicles in Household |
| Immigrants | Micronesia | 100.0 /100 | #63 | Exceptional 7.6% |
| Bangladeshis | 100.0 /100 | #64 | Exceptional 7.6% |
| Immigrants | Azores | 100.0 /100 | #65 | Exceptional 7.5% |
| Immigrants | Taiwan | 99.9 /100 | #66 | Exceptional 7.5% |
| Americans | 99.9 /100 | #67 | Exceptional 7.5% |
| Welsh | 99.9 /100 | #68 | Exceptional 7.5% |
| Germans | 99.9 /100 | #69 | Exceptional 7.5% |
| Scottish | 99.9 /100 | #70 | Exceptional 7.4% |
| Chickasaw | 99.9 /100 | #71 | Exceptional 7.4% |
| Scotch-Irish | 99.9 /100 | #72 | Exceptional 7.4% |
| Portuguese | 99.9 /100 | #73 | Exceptional 7.4% |
| Icelanders | 99.9 /100 | #74 | Exceptional 7.4% |
| Immigrants | Cambodia | 99.9 /100 | #75 | Exceptional 7.4% |
| Laotians | 99.9 /100 | #76 | Exceptional 7.4% |
| Apache | 99.9 /100 | #77 | Exceptional 7.4% |
Demographics Similar to Immigrants from Ethiopia by 4 or more Vehicles in Household
In terms of 4 or more vehicles in household, the demographic groups most similar to Immigrants from Ethiopia are Immigrants from North Macedonia (5.7%, a difference of 0.030%), Immigrants from Eastern Africa (5.7%, a difference of 0.11%), Immigrants from Southern Europe (5.7%, a difference of 0.13%), Immigrants from Europe (5.7%, a difference of 0.23%), and Ugandan (5.7%, a difference of 0.25%).
| Demographics | Rating | Rank | 4 or more Vehicles in Household |
| Immigrants | Poland | 3.8 /100 | #240 | Tragic 5.8% |
| Mongolians | 3.7 /100 | #241 | Tragic 5.8% |
| Immigrants | Middle Africa | 3.4 /100 | #242 | Tragic 5.8% |
| Immigrants | Czechoslovakia | 3.2 /100 | #243 | Tragic 5.8% |
| Ethiopians | 3.2 /100 | #244 | Tragic 5.8% |
| Bulgarians | 3.1 /100 | #245 | Tragic 5.8% |
| Immigrants | North Macedonia | 2.5 /100 | #246 | Tragic 5.7% |
| Immigrants | Ethiopia | 2.4 /100 | #247 | Tragic 5.7% |
| Immigrants | Eastern Africa | 2.4 /100 | #248 | Tragic 5.7% |
| Immigrants | Southern Europe | 2.3 /100 | #249 | Tragic 5.7% |
| Immigrants | Europe | 2.3 /100 | #250 | Tragic 5.7% |
| Ugandans | 2.2 /100 | #251 | Tragic 5.7% |
| Sub-Saharan Africans | 2.1 /100 | #252 | Tragic 5.7% |
| Immigrants | Cuba | 1.6 /100 | #253 | Tragic 5.7% |
| Immigrants | Panama | 1.5 /100 | #254 | Tragic 5.7% |