Scottish vs Ute 4 or more Vehicles in Household
COMPARE
Scottish
Ute
4 or more Vehicles in Household
4 or more Vehicles in Household Comparison
Scottish
Ute
7.4%
4 OR MORE VEHICLES IN HOUSEHOLD
99.9/ 100
METRIC RATING
70th/ 347
METRIC RANK
8.8%
4 OR MORE VEHICLES IN HOUSEHOLD
100.0/ 100
METRIC RATING
17th/ 347
METRIC RANK
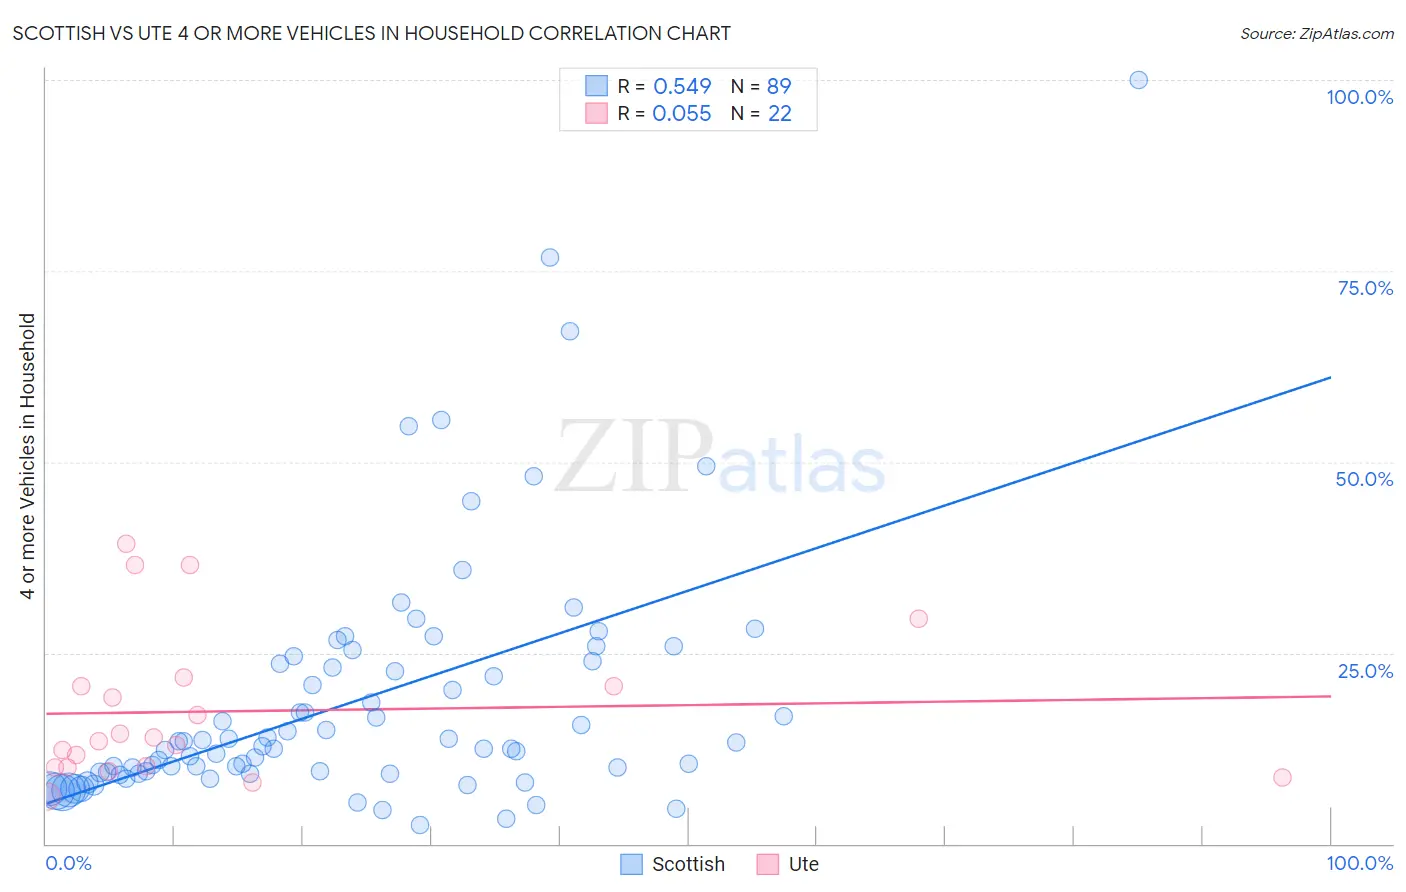
Scottish vs Ute 4 or more Vehicles in Household Correlation Chart
The statistical analysis conducted on geographies consisting of 563,736,274 people shows a substantial positive correlation between the proportion of Scottish and percentage of households with 4 or more vehicles available in the United States with a correlation coefficient (R) of 0.549 and weighted average of 7.4%. Similarly, the statistical analysis conducted on geographies consisting of 55,645,386 people shows a slight positive correlation between the proportion of Ute and percentage of households with 4 or more vehicles available in the United States with a correlation coefficient (R) of 0.055 and weighted average of 8.8%, a difference of 17.6%.
4 or more Vehicles in Household Correlation Summary
| Measurement | Scottish | Ute |
| Minimum | 2.5% | 6.2% |
| Maximum | 100.0% | 39.3% |
| Range | 97.5% | 33.1% |
| Mean | 18.7% | 17.4% |
| Median | 12.8% | 13.7% |
| Interquartile 25% (IQ1) | 9.3% | 10.0% |
| Interquartile 75% (IQ3) | 23.8% | 20.7% |
| Interquartile Range (IQR) | 14.5% | 10.6% |
| Standard Deviation (Sample) | 16.4% | 9.8% |
| Standard Deviation (Population) | 16.3% | 9.6% |
Similar Demographics by 4 or more Vehicles in Household
Demographics Similar to Scottish by 4 or more Vehicles in Household
In terms of 4 or more vehicles in household, the demographic groups most similar to Scottish are German (7.5%, a difference of 0.070%), Chickasaw (7.4%, a difference of 0.13%), Scotch-Irish (7.4%, a difference of 0.43%), Portuguese (7.4%, a difference of 0.52%), and Welsh (7.5%, a difference of 0.67%).
| Demographics | Rating | Rank | 4 or more Vehicles in Household |
| Immigrants | Micronesia | 100.0 /100 | #63 | Exceptional 7.6% |
| Bangladeshis | 100.0 /100 | #64 | Exceptional 7.6% |
| Immigrants | Azores | 100.0 /100 | #65 | Exceptional 7.5% |
| Immigrants | Taiwan | 99.9 /100 | #66 | Exceptional 7.5% |
| Americans | 99.9 /100 | #67 | Exceptional 7.5% |
| Welsh | 99.9 /100 | #68 | Exceptional 7.5% |
| Germans | 99.9 /100 | #69 | Exceptional 7.5% |
| Scottish | 99.9 /100 | #70 | Exceptional 7.4% |
| Chickasaw | 99.9 /100 | #71 | Exceptional 7.4% |
| Scotch-Irish | 99.9 /100 | #72 | Exceptional 7.4% |
| Portuguese | 99.9 /100 | #73 | Exceptional 7.4% |
| Icelanders | 99.9 /100 | #74 | Exceptional 7.4% |
| Immigrants | Cambodia | 99.9 /100 | #75 | Exceptional 7.4% |
| Laotians | 99.9 /100 | #76 | Exceptional 7.4% |
| Apache | 99.9 /100 | #77 | Exceptional 7.4% |
Demographics Similar to Ute by 4 or more Vehicles in Household
In terms of 4 or more vehicles in household, the demographic groups most similar to Ute are Nepalese (8.7%, a difference of 0.10%), Lumbee (8.8%, a difference of 0.33%), Shoshone (8.8%, a difference of 1.1%), Chinese (8.8%, a difference of 1.1%), and Korean (8.6%, a difference of 1.3%).
| Demographics | Rating | Rank | 4 or more Vehicles in Household |
| Paiute | 100.0 /100 | #10 | Exceptional 9.0% |
| Immigrants | Mexico | 100.0 /100 | #11 | Exceptional 9.0% |
| Mexicans | 100.0 /100 | #12 | Exceptional 8.9% |
| Hawaiians | 100.0 /100 | #13 | Exceptional 8.9% |
| Chinese | 100.0 /100 | #14 | Exceptional 8.8% |
| Shoshone | 100.0 /100 | #15 | Exceptional 8.8% |
| Lumbee | 100.0 /100 | #16 | Exceptional 8.8% |
| Ute | 100.0 /100 | #17 | Exceptional 8.8% |
| Nepalese | 100.0 /100 | #18 | Exceptional 8.7% |
| Koreans | 100.0 /100 | #19 | Exceptional 8.6% |
| Pueblo | 100.0 /100 | #20 | Exceptional 8.6% |
| Danes | 100.0 /100 | #21 | Exceptional 8.6% |
| Immigrants | Vietnam | 100.0 /100 | #22 | Exceptional 8.6% |
| Immigrants | Philippines | 100.0 /100 | #23 | Exceptional 8.5% |
| Immigrants | Central America | 100.0 /100 | #24 | Exceptional 8.5% |