Jordanian vs Immigrants from Ethiopia 4 or more Vehicles in Household
COMPARE
Jordanian
Immigrants from Ethiopia
4 or more Vehicles in Household
4 or more Vehicles in Household Comparison
Jordanians
Immigrants from Ethiopia
6.6%
4 OR MORE VEHICLES IN HOUSEHOLD
82.1/ 100
METRIC RATING
139th/ 347
METRIC RANK
5.7%
4 OR MORE VEHICLES IN HOUSEHOLD
2.4/ 100
METRIC RATING
247th/ 347
METRIC RANK
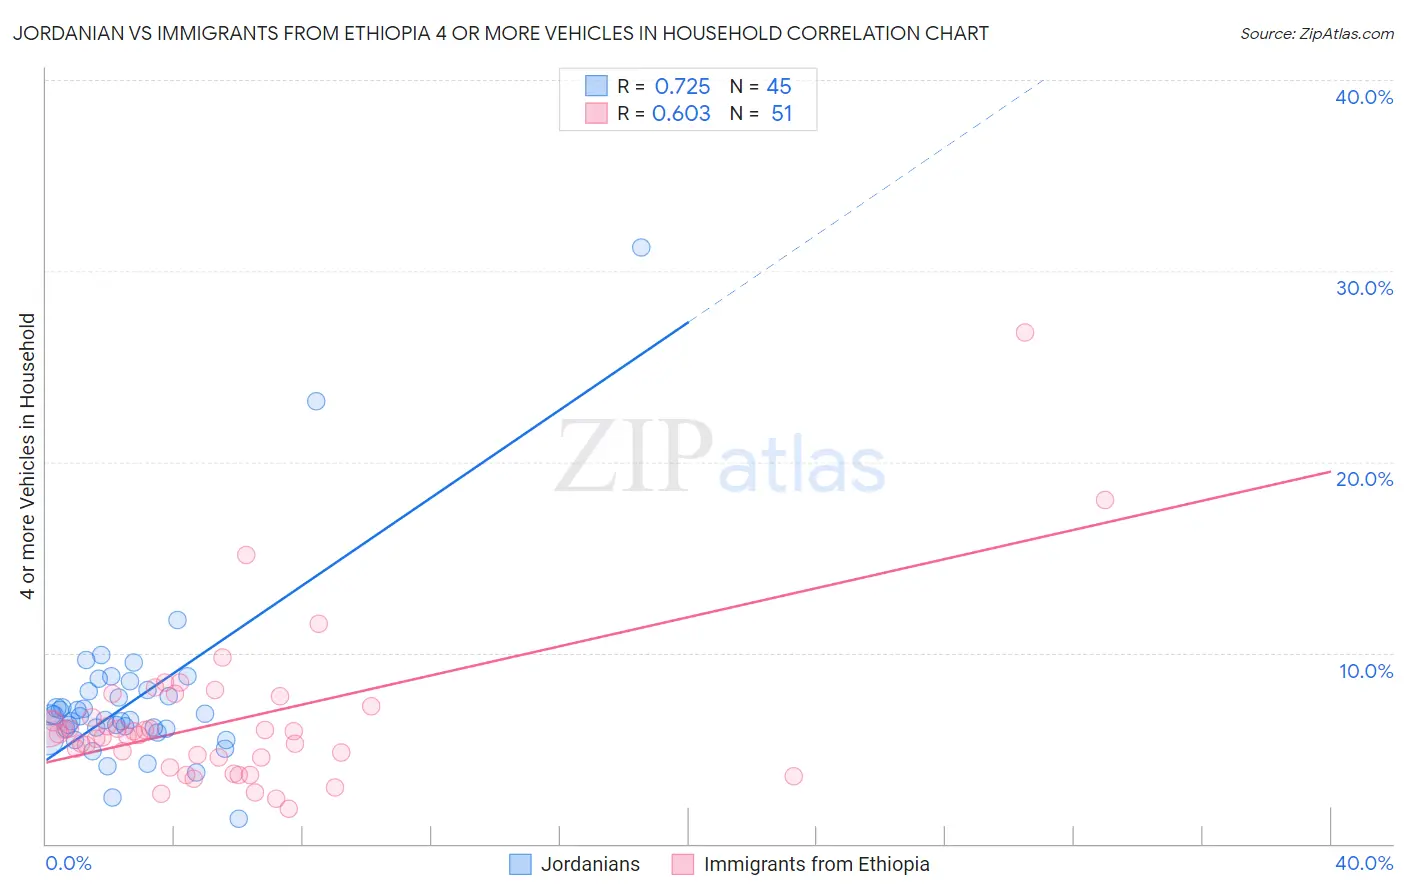
Jordanian vs Immigrants from Ethiopia 4 or more Vehicles in Household Correlation Chart
The statistical analysis conducted on geographies consisting of 166,057,251 people shows a strong positive correlation between the proportion of Jordanians and percentage of households with 4 or more vehicles available in the United States with a correlation coefficient (R) of 0.725 and weighted average of 6.6%. Similarly, the statistical analysis conducted on geographies consisting of 210,800,078 people shows a significant positive correlation between the proportion of Immigrants from Ethiopia and percentage of households with 4 or more vehicles available in the United States with a correlation coefficient (R) of 0.603 and weighted average of 5.7%, a difference of 14.5%.
4 or more Vehicles in Household Correlation Summary
| Measurement | Jordanian | Immigrants from Ethiopia |
| Minimum | 1.3% | 1.8% |
| Maximum | 31.2% | 26.8% |
| Range | 30.0% | 24.9% |
| Mean | 7.6% | 6.4% |
| Median | 6.7% | 5.8% |
| Interquartile 25% (IQ1) | 5.9% | 4.5% |
| Interquartile 75% (IQ3) | 8.0% | 7.2% |
| Interquartile Range (IQR) | 2.1% | 2.7% |
| Standard Deviation (Sample) | 4.8% | 4.1% |
| Standard Deviation (Population) | 4.7% | 4.1% |
Similar Demographics by 4 or more Vehicles in Household
Demographics Similar to Jordanians by 4 or more Vehicles in Household
In terms of 4 or more vehicles in household, the demographic groups most similar to Jordanians are Slavic (6.6%, a difference of 0.080%), Australian (6.6%, a difference of 0.21%), Immigrants from Iraq (6.5%, a difference of 0.41%), Italian (6.6%, a difference of 0.43%), and Immigrants from Canada (6.5%, a difference of 0.54%).
| Demographics | Rating | Rank | 4 or more Vehicles in Household |
| Immigrants | Netherlands | 87.8 /100 | #132 | Excellent 6.6% |
| Armenians | 86.9 /100 | #133 | Excellent 6.6% |
| Ottawa | 86.9 /100 | #134 | Excellent 6.6% |
| Tohono O'odham | 86.7 /100 | #135 | Excellent 6.6% |
| Luxembourgers | 86.4 /100 | #136 | Excellent 6.6% |
| French Canadians | 85.4 /100 | #137 | Excellent 6.6% |
| Italians | 84.5 /100 | #138 | Excellent 6.6% |
| Jordanians | 82.1 /100 | #139 | Excellent 6.6% |
| Slavs | 81.6 /100 | #140 | Excellent 6.6% |
| Australians | 80.8 /100 | #141 | Excellent 6.6% |
| Immigrants | Iraq | 79.4 /100 | #142 | Good 6.5% |
| Immigrants | Canada | 78.6 /100 | #143 | Good 6.5% |
| Immigrants | North America | 78.5 /100 | #144 | Good 6.5% |
| Croatians | 77.8 /100 | #145 | Good 6.5% |
| Immigrants | Costa Rica | 74.4 /100 | #146 | Good 6.5% |
Demographics Similar to Immigrants from Ethiopia by 4 or more Vehicles in Household
In terms of 4 or more vehicles in household, the demographic groups most similar to Immigrants from Ethiopia are Immigrants from North Macedonia (5.7%, a difference of 0.030%), Immigrants from Eastern Africa (5.7%, a difference of 0.11%), Immigrants from Southern Europe (5.7%, a difference of 0.13%), Immigrants from Europe (5.7%, a difference of 0.23%), and Ugandan (5.7%, a difference of 0.25%).
| Demographics | Rating | Rank | 4 or more Vehicles in Household |
| Immigrants | Poland | 3.8 /100 | #240 | Tragic 5.8% |
| Mongolians | 3.7 /100 | #241 | Tragic 5.8% |
| Immigrants | Middle Africa | 3.4 /100 | #242 | Tragic 5.8% |
| Immigrants | Czechoslovakia | 3.2 /100 | #243 | Tragic 5.8% |
| Ethiopians | 3.2 /100 | #244 | Tragic 5.8% |
| Bulgarians | 3.1 /100 | #245 | Tragic 5.8% |
| Immigrants | North Macedonia | 2.5 /100 | #246 | Tragic 5.7% |
| Immigrants | Ethiopia | 2.4 /100 | #247 | Tragic 5.7% |
| Immigrants | Eastern Africa | 2.4 /100 | #248 | Tragic 5.7% |
| Immigrants | Southern Europe | 2.3 /100 | #249 | Tragic 5.7% |
| Immigrants | Europe | 2.3 /100 | #250 | Tragic 5.7% |
| Ugandans | 2.2 /100 | #251 | Tragic 5.7% |
| Sub-Saharan Africans | 2.1 /100 | #252 | Tragic 5.7% |
| Immigrants | Cuba | 1.6 /100 | #253 | Tragic 5.7% |
| Immigrants | Panama | 1.5 /100 | #254 | Tragic 5.7% |