Immigrants from Portugal vs Ecuadorian No Vehicles in Household
COMPARE
Immigrants from Portugal
Ecuadorian
No Vehicles in Household
No Vehicles in Household Comparison
Immigrants from Portugal
Ecuadorians
11.7%
NO VEHICLES IN HOUSEHOLD
2.2/ 100
METRIC RATING
244th/ 347
METRIC RANK
22.8%
NO VEHICLES IN HOUSEHOLD
0.0/ 100
METRIC RATING
329th/ 347
METRIC RANK
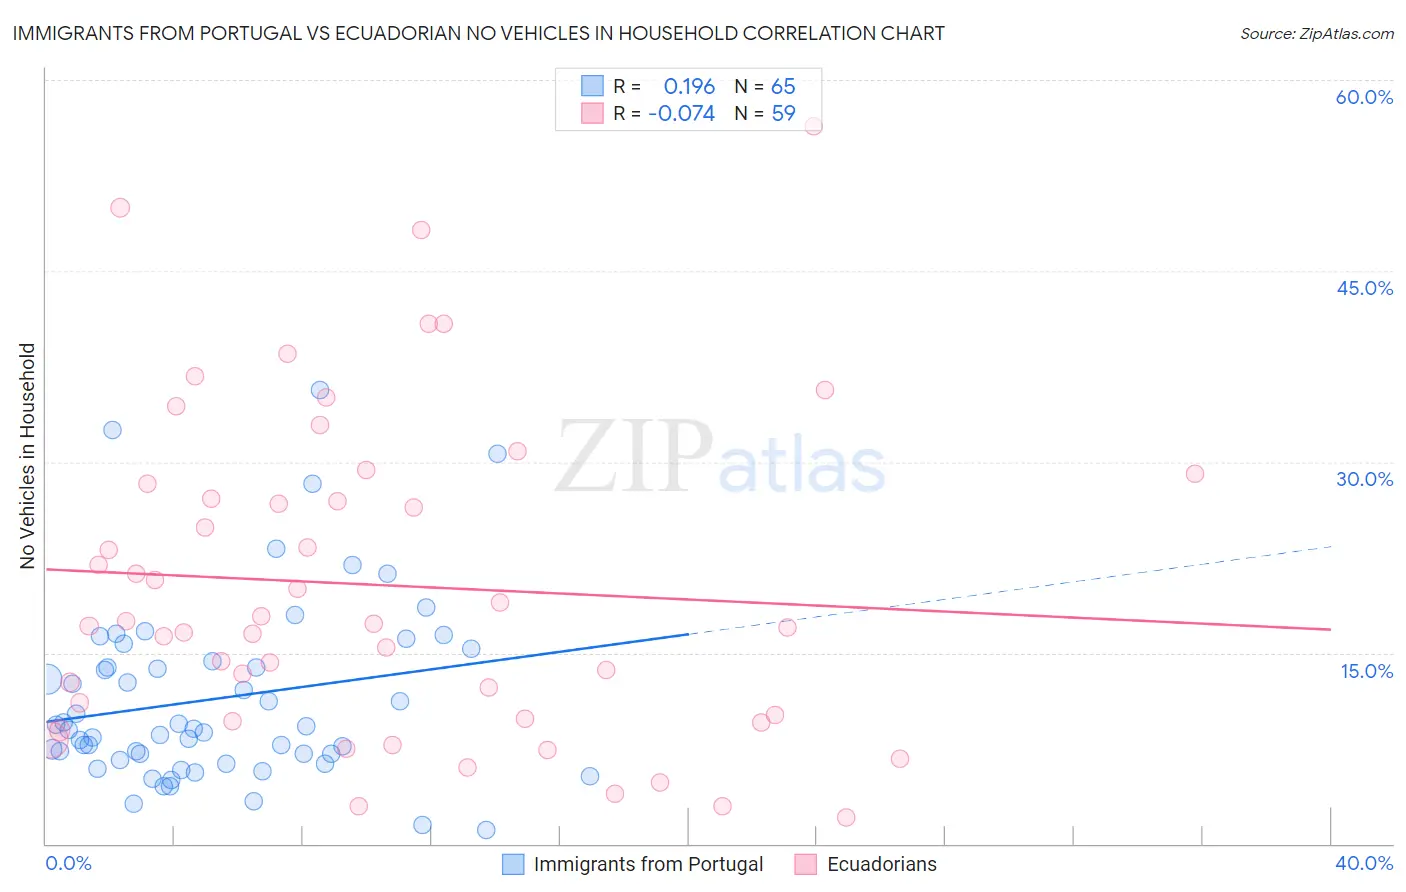
Immigrants from Portugal vs Ecuadorian No Vehicles in Household Correlation Chart
The statistical analysis conducted on geographies consisting of 174,581,030 people shows a poor positive correlation between the proportion of Immigrants from Portugal and percentage of households with no vehicle available in the United States with a correlation coefficient (R) of 0.196 and weighted average of 11.7%. Similarly, the statistical analysis conducted on geographies consisting of 317,233,310 people shows a slight negative correlation between the proportion of Ecuadorians and percentage of households with no vehicle available in the United States with a correlation coefficient (R) of -0.074 and weighted average of 22.8%, a difference of 93.8%.
No Vehicles in Household Correlation Summary
| Measurement | Immigrants from Portugal | Ecuadorian |
| Minimum | 1.1% | 2.1% |
| Maximum | 35.7% | 56.4% |
| Range | 34.6% | 54.3% |
| Mean | 11.4% | 20.3% |
| Median | 9.0% | 17.3% |
| Interquartile 25% (IQ1) | 6.8% | 9.8% |
| Interquartile 75% (IQ3) | 14.9% | 28.3% |
| Interquartile Range (IQR) | 8.1% | 18.5% |
| Standard Deviation (Sample) | 7.2% | 12.7% |
| Standard Deviation (Population) | 7.1% | 12.5% |
Similar Demographics by No Vehicles in Household
Demographics Similar to Immigrants from Portugal by No Vehicles in Household
In terms of no vehicles in household, the demographic groups most similar to Immigrants from Portugal are Cheyenne (11.7%, a difference of 0.18%), Immigrants from Honduras (11.8%, a difference of 0.19%), Menominee (11.8%, a difference of 0.36%), Immigrants from Czechoslovakia (11.8%, a difference of 0.41%), and Immigrants from Belgium (11.8%, a difference of 0.42%).
| Demographics | Rating | Rank | No Vehicles in Household |
| Ute | 3.3 /100 | #237 | Tragic 11.6% |
| Russians | 3.2 /100 | #238 | Tragic 11.6% |
| Taiwanese | 2.8 /100 | #239 | Tragic 11.7% |
| Immigrants | Immigrants | 2.7 /100 | #240 | Tragic 11.7% |
| Eastern Europeans | 2.7 /100 | #241 | Tragic 11.7% |
| Turks | 2.6 /100 | #242 | Tragic 11.7% |
| Cheyenne | 2.4 /100 | #243 | Tragic 11.7% |
| Immigrants | Portugal | 2.2 /100 | #244 | Tragic 11.7% |
| Immigrants | Honduras | 2.1 /100 | #245 | Tragic 11.8% |
| Menominee | 2.0 /100 | #246 | Tragic 11.8% |
| Immigrants | Czechoslovakia | 2.0 /100 | #247 | Tragic 11.8% |
| Immigrants | Belgium | 1.9 /100 | #248 | Tragic 11.8% |
| Immigrants | Nigeria | 1.9 /100 | #249 | Tragic 11.8% |
| Paiute | 1.8 /100 | #250 | Tragic 11.8% |
| Blacks/African Americans | 1.6 /100 | #251 | Tragic 11.9% |
Demographics Similar to Ecuadorians by No Vehicles in Household
In terms of no vehicles in household, the demographic groups most similar to Ecuadorians are Immigrants from Dominica (22.2%, a difference of 2.3%), West Indian (23.7%, a difference of 4.2%), Trinidadian and Tobagonian (23.7%, a difference of 4.4%), Immigrants from Ecuador (23.8%, a difference of 4.7%), and Immigrants from Senegal (21.1%, a difference of 7.6%).
| Demographics | Rating | Rank | No Vehicles in Household |
| Immigrants | Cabo Verde | 0.0 /100 | #322 | Tragic 18.4% |
| Immigrants | Yemen | 0.0 /100 | #323 | Tragic 19.5% |
| Immigrants | Caribbean | 0.0 /100 | #324 | Tragic 19.6% |
| Senegalese | 0.0 /100 | #325 | Tragic 19.8% |
| Immigrants | West Indies | 0.0 /100 | #326 | Tragic 20.5% |
| Immigrants | Senegal | 0.0 /100 | #327 | Tragic 21.1% |
| Immigrants | Dominica | 0.0 /100 | #328 | Tragic 22.2% |
| Ecuadorians | 0.0 /100 | #329 | Tragic 22.8% |
| West Indians | 0.0 /100 | #330 | Tragic 23.7% |
| Trinidadians and Tobagonians | 0.0 /100 | #331 | Tragic 23.7% |
| Immigrants | Ecuador | 0.0 /100 | #332 | Tragic 23.8% |
| Immigrants | Trinidad and Tobago | 0.0 /100 | #333 | Tragic 24.6% |
| Immigrants | Bangladesh | 0.0 /100 | #334 | Tragic 25.8% |
| Barbadians | 0.0 /100 | #335 | Tragic 26.1% |
| Vietnamese | 0.0 /100 | #336 | Tragic 26.2% |