Ghanaian vs Ecuadorian No Vehicles in Household
COMPARE
Ghanaian
Ecuadorian
No Vehicles in Household
No Vehicles in Household Comparison
Ghanaians
Ecuadorians
16.4%
NO VEHICLES IN HOUSEHOLD
0.0/ 100
METRIC RATING
316th/ 347
METRIC RANK
22.8%
NO VEHICLES IN HOUSEHOLD
0.0/ 100
METRIC RATING
329th/ 347
METRIC RANK
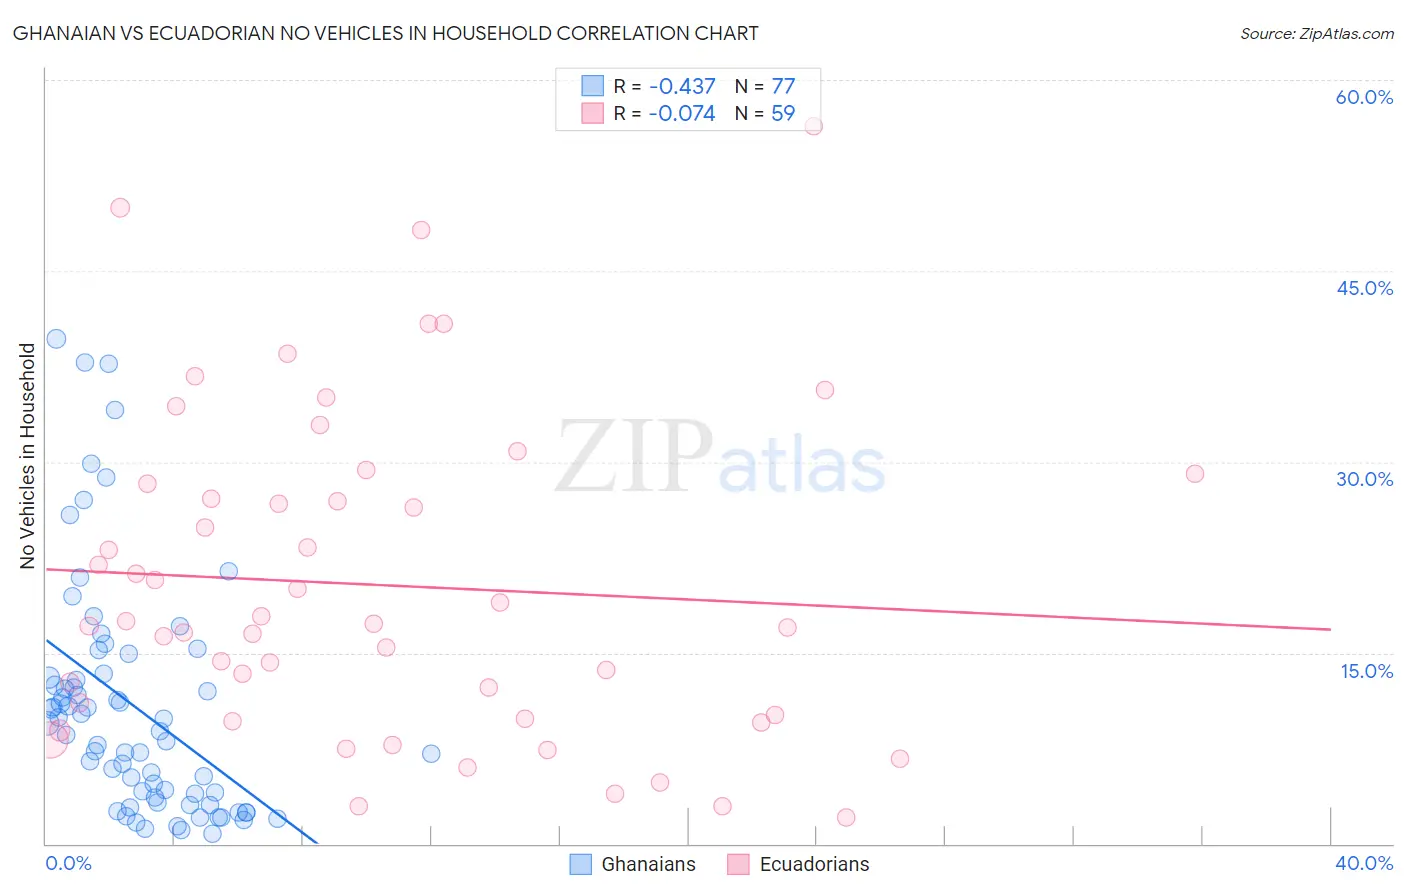
Ghanaian vs Ecuadorian No Vehicles in Household Correlation Chart
The statistical analysis conducted on geographies consisting of 190,166,774 people shows a moderate negative correlation between the proportion of Ghanaians and percentage of households with no vehicle available in the United States with a correlation coefficient (R) of -0.437 and weighted average of 16.4%. Similarly, the statistical analysis conducted on geographies consisting of 317,233,310 people shows a slight negative correlation between the proportion of Ecuadorians and percentage of households with no vehicle available in the United States with a correlation coefficient (R) of -0.074 and weighted average of 22.8%, a difference of 38.4%.
No Vehicles in Household Correlation Summary
| Measurement | Ghanaian | Ecuadorian |
| Minimum | 0.75% | 2.1% |
| Maximum | 39.6% | 56.4% |
| Range | 38.9% | 54.3% |
| Mean | 10.7% | 20.3% |
| Median | 8.9% | 17.3% |
| Interquartile 25% (IQ1) | 3.5% | 9.8% |
| Interquartile 75% (IQ3) | 13.2% | 28.3% |
| Interquartile Range (IQR) | 9.7% | 18.5% |
| Standard Deviation (Sample) | 9.2% | 12.7% |
| Standard Deviation (Population) | 9.2% | 12.5% |
Demographics Similar to Ghanaians and Ecuadorians by No Vehicles in Household
In terms of no vehicles in household, the demographic groups most similar to Ghanaians are Immigrants from Ghana (16.6%, a difference of 0.95%), Immigrants from Belarus (16.7%, a difference of 1.8%), Cypriot (15.7%, a difference of 5.0%), Albanian (15.6%, a difference of 5.1%), and Tohono O'odham (15.6%, a difference of 5.3%). Similarly, the demographic groups most similar to Ecuadorians are Immigrants from Dominica (22.2%, a difference of 2.3%), West Indian (23.7%, a difference of 4.2%), Trinidadian and Tobagonian (23.7%, a difference of 4.4%), Immigrants from Ecuador (23.8%, a difference of 4.7%), and Immigrants from Senegal (21.1%, a difference of 7.6%).
| Demographics | Rating | Rank | No Vehicles in Household |
| Alaskan Athabascans | 0.0 /100 | #312 | Tragic 15.6% |
| Tohono O'odham | 0.0 /100 | #313 | Tragic 15.6% |
| Albanians | 0.0 /100 | #314 | Tragic 15.6% |
| Cypriots | 0.0 /100 | #315 | Tragic 15.7% |
| Ghanaians | 0.0 /100 | #316 | Tragic 16.4% |
| Immigrants | Ghana | 0.0 /100 | #317 | Tragic 16.6% |
| Immigrants | Belarus | 0.0 /100 | #318 | Tragic 16.7% |
| Alaska Natives | 0.0 /100 | #319 | Tragic 17.4% |
| Soviet Union | 0.0 /100 | #320 | Tragic 17.4% |
| Jamaicans | 0.0 /100 | #321 | Tragic 17.9% |
| Immigrants | Cabo Verde | 0.0 /100 | #322 | Tragic 18.4% |
| Immigrants | Yemen | 0.0 /100 | #323 | Tragic 19.5% |
| Immigrants | Caribbean | 0.0 /100 | #324 | Tragic 19.6% |
| Senegalese | 0.0 /100 | #325 | Tragic 19.8% |
| Immigrants | West Indies | 0.0 /100 | #326 | Tragic 20.5% |
| Immigrants | Senegal | 0.0 /100 | #327 | Tragic 21.1% |
| Immigrants | Dominica | 0.0 /100 | #328 | Tragic 22.2% |
| Ecuadorians | 0.0 /100 | #329 | Tragic 22.8% |
| West Indians | 0.0 /100 | #330 | Tragic 23.7% |
| Trinidadians and Tobagonians | 0.0 /100 | #331 | Tragic 23.7% |
| Immigrants | Ecuador | 0.0 /100 | #332 | Tragic 23.8% |