Scotch-Irish vs Cree Unemployment Among Seniors over 65 years
COMPARE
Scotch-Irish
Cree
Unemployment Among Seniors over 65 years
Unemployment Among Seniors over 65 years Comparison
Scotch-Irish
Cree
4.9%
UNEMPLOYMENT AMONG SENIORS OVER 65 YEARS
99.9/ 100
METRIC RATING
51st/ 347
METRIC RANK
5.3%
UNEMPLOYMENT AMONG SENIORS OVER 65 YEARS
5.8/ 100
METRIC RATING
223rd/ 347
METRIC RANK
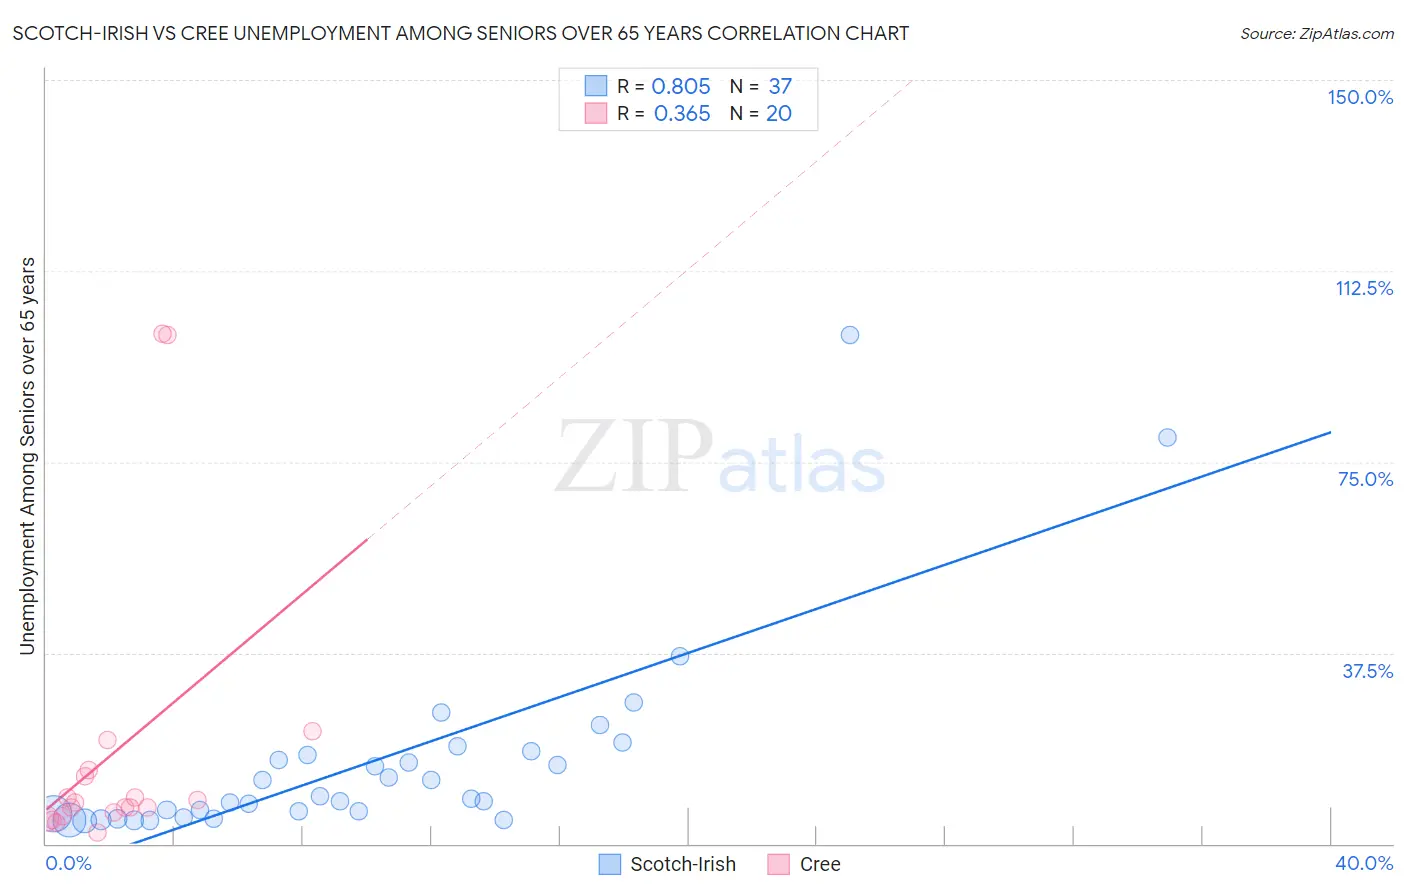
Scotch-Irish vs Cree Unemployment Among Seniors over 65 years Correlation Chart
The statistical analysis conducted on geographies consisting of 447,057,926 people shows a very strong positive correlation between the proportion of Scotch-Irish and unemployment rate amomg seniors over the age of 65 in the United States with a correlation coefficient (R) of 0.805 and weighted average of 4.9%. Similarly, the statistical analysis conducted on geographies consisting of 73,743,775 people shows a mild positive correlation between the proportion of Cree and unemployment rate amomg seniors over the age of 65 in the United States with a correlation coefficient (R) of 0.365 and weighted average of 5.3%, a difference of 7.9%.
Unemployment Among Seniors over 65 years Correlation Summary
| Measurement | Scotch-Irish | Cree |
| Minimum | 4.4% | 2.3% |
| Maximum | 100.0% | 100.1% |
| Range | 95.6% | 97.8% |
| Mean | 16.1% | 18.1% |
| Median | 8.9% | 7.7% |
| Interquartile 25% (IQ1) | 5.4% | 5.8% |
| Interquartile 75% (IQ3) | 17.8% | 13.8% |
| Interquartile Range (IQR) | 12.3% | 8.0% |
| Standard Deviation (Sample) | 19.6% | 28.5% |
| Standard Deviation (Population) | 19.4% | 27.8% |
Similar Demographics by Unemployment Among Seniors over 65 years
Demographics Similar to Scotch-Irish by Unemployment Among Seniors over 65 years
In terms of unemployment among seniors over 65 years, the demographic groups most similar to Scotch-Irish are Swedish (4.9%, a difference of 0.020%), Immigrants from Sudan (4.9%, a difference of 0.060%), Immigrants from Austria (4.9%, a difference of 0.12%), Immigrants from Iraq (4.9%, a difference of 0.12%), and Immigrants from Kenya (4.9%, a difference of 0.13%).
| Demographics | Rating | Rank | Unemployment Among Seniors over 65 years |
| Jordanians | 99.9 /100 | #44 | Exceptional 4.9% |
| Ethiopians | 99.9 /100 | #45 | Exceptional 4.9% |
| Immigrants | Jordan | 99.9 /100 | #46 | Exceptional 4.9% |
| Germans | 99.9 /100 | #47 | Exceptional 4.9% |
| Choctaw | 99.9 /100 | #48 | Exceptional 4.9% |
| Immigrants | Kenya | 99.9 /100 | #49 | Exceptional 4.9% |
| Immigrants | Austria | 99.9 /100 | #50 | Exceptional 4.9% |
| Scotch-Irish | 99.9 /100 | #51 | Exceptional 4.9% |
| Swedes | 99.9 /100 | #52 | Exceptional 4.9% |
| Immigrants | Sudan | 99.8 /100 | #53 | Exceptional 4.9% |
| Immigrants | Iraq | 99.8 /100 | #54 | Exceptional 4.9% |
| Europeans | 99.8 /100 | #55 | Exceptional 4.9% |
| Carpatho Rusyns | 99.8 /100 | #56 | Exceptional 4.9% |
| Danes | 99.8 /100 | #57 | Exceptional 4.9% |
| Scandinavians | 99.8 /100 | #58 | Exceptional 4.9% |
Demographics Similar to Cree by Unemployment Among Seniors over 65 years
In terms of unemployment among seniors over 65 years, the demographic groups most similar to Cree are Immigrants from Syria (5.3%, a difference of 0.020%), Honduran (5.3%, a difference of 0.030%), Israeli (5.3%, a difference of 0.060%), Immigrants from Croatia (5.3%, a difference of 0.070%), and Arapaho (5.3%, a difference of 0.080%).
| Demographics | Rating | Rank | Unemployment Among Seniors over 65 years |
| Cajuns | 8.5 /100 | #216 | Tragic 5.2% |
| Italians | 8.3 /100 | #217 | Tragic 5.2% |
| Spaniards | 7.4 /100 | #218 | Tragic 5.2% |
| Dutch West Indians | 6.9 /100 | #219 | Tragic 5.3% |
| Egyptians | 6.4 /100 | #220 | Tragic 5.3% |
| Arapaho | 6.3 /100 | #221 | Tragic 5.3% |
| Israelis | 6.2 /100 | #222 | Tragic 5.3% |
| Cree | 5.8 /100 | #223 | Tragic 5.3% |
| Immigrants | Syria | 5.6 /100 | #224 | Tragic 5.3% |
| Hondurans | 5.6 /100 | #225 | Tragic 5.3% |
| Immigrants | Croatia | 5.3 /100 | #226 | Tragic 5.3% |
| French American Indians | 5.2 /100 | #227 | Tragic 5.3% |
| Haitians | 4.4 /100 | #228 | Tragic 5.3% |
| Samoans | 4.2 /100 | #229 | Tragic 5.3% |
| Immigrants | Argentina | 4.0 /100 | #230 | Tragic 5.3% |