Iranian vs Cree No Vehicles in Household
COMPARE
Iranian
Cree
No Vehicles in Household
No Vehicles in Household Comparison
Iranians
Cree
8.6%
NO VEHICLES IN HOUSEHOLD
99.5/ 100
METRIC RATING
77th/ 347
METRIC RANK
11.6%
NO VEHICLES IN HOUSEHOLD
3.5/ 100
METRIC RATING
236th/ 347
METRIC RANK
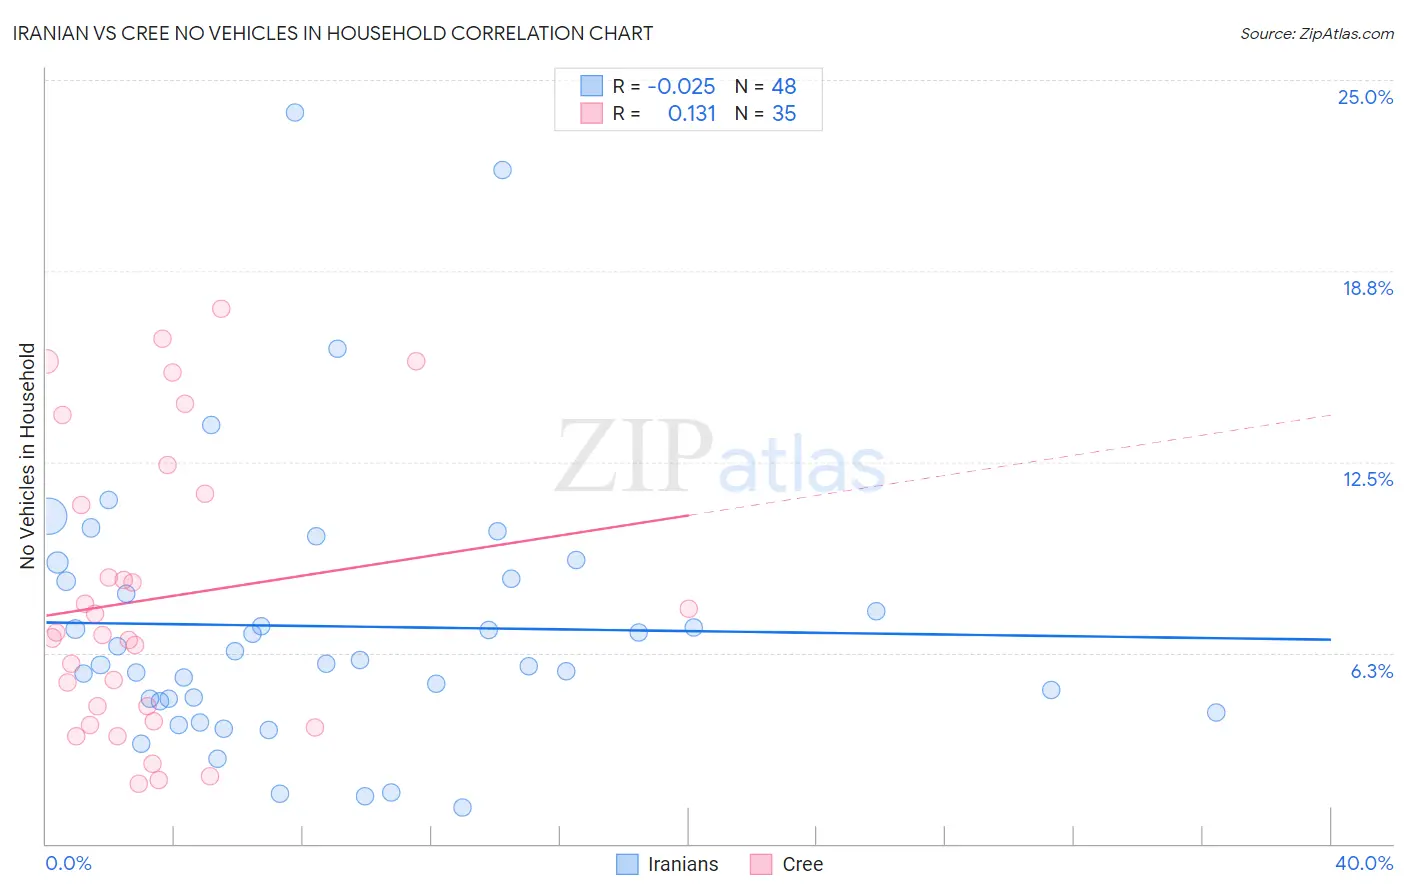
Iranian vs Cree No Vehicles in Household Correlation Chart
The statistical analysis conducted on geographies consisting of 316,234,077 people shows no correlation between the proportion of Iranians and percentage of households with no vehicle available in the United States with a correlation coefficient (R) of -0.025 and weighted average of 8.6%. Similarly, the statistical analysis conducted on geographies consisting of 76,143,133 people shows a poor positive correlation between the proportion of Cree and percentage of households with no vehicle available in the United States with a correlation coefficient (R) of 0.131 and weighted average of 11.6%, a difference of 35.2%.
No Vehicles in Household Correlation Summary
| Measurement | Iranian | Cree |
| Minimum | 1.2% | 2.0% |
| Maximum | 24.0% | 17.5% |
| Range | 22.8% | 15.6% |
| Mean | 7.1% | 8.0% |
| Median | 6.0% | 6.8% |
| Interquartile 25% (IQ1) | 4.7% | 4.0% |
| Interquartile 75% (IQ3) | 8.6% | 11.5% |
| Interquartile Range (IQR) | 3.9% | 7.4% |
| Standard Deviation (Sample) | 4.5% | 4.7% |
| Standard Deviation (Population) | 4.5% | 4.6% |
Similar Demographics by No Vehicles in Household
Demographics Similar to Iranians by No Vehicles in Household
In terms of no vehicles in household, the demographic groups most similar to Iranians are Immigrants from Philippines (8.5%, a difference of 0.090%), Immigrants from South Central Asia (8.6%, a difference of 0.12%), Portuguese (8.6%, a difference of 0.18%), Bolivian (8.6%, a difference of 0.32%), and Jordanian (8.5%, a difference of 0.33%).
| Demographics | Rating | Rank | No Vehicles in Household |
| Cajuns | 99.6 /100 | #70 | Exceptional 8.4% |
| Immigrants | Lebanon | 99.6 /100 | #71 | Exceptional 8.4% |
| Lithuanians | 99.6 /100 | #72 | Exceptional 8.4% |
| Poles | 99.6 /100 | #73 | Exceptional 8.4% |
| Cubans | 99.5 /100 | #74 | Exceptional 8.5% |
| Jordanians | 99.5 /100 | #75 | Exceptional 8.5% |
| Immigrants | Philippines | 99.5 /100 | #76 | Exceptional 8.5% |
| Iranians | 99.5 /100 | #77 | Exceptional 8.6% |
| Immigrants | South Central Asia | 99.5 /100 | #78 | Exceptional 8.6% |
| Portuguese | 99.5 /100 | #79 | Exceptional 8.6% |
| Bolivians | 99.4 /100 | #80 | Exceptional 8.6% |
| Tsimshian | 99.4 /100 | #81 | Exceptional 8.6% |
| Immigrants | South Eastern Asia | 99.4 /100 | #82 | Exceptional 8.6% |
| Italians | 99.4 /100 | #83 | Exceptional 8.6% |
| Immigrants | Jordan | 99.3 /100 | #84 | Exceptional 8.7% |
Demographics Similar to Cree by No Vehicles in Household
In terms of no vehicles in household, the demographic groups most similar to Cree are Ute (11.6%, a difference of 0.24%), Russian (11.6%, a difference of 0.29%), Kiowa (11.5%, a difference of 0.35%), Immigrants from Peru (11.5%, a difference of 0.73%), and Taiwanese (11.7%, a difference of 0.75%).
| Demographics | Rating | Rank | No Vehicles in Household |
| Ugandans | 5.3 /100 | #229 | Tragic 11.4% |
| Immigrants | Norway | 5.1 /100 | #230 | Tragic 11.4% |
| Immigrants | Japan | 5.1 /100 | #231 | Tragic 11.4% |
| Immigrants | Turkey | 4.8 /100 | #232 | Tragic 11.5% |
| Houma | 4.7 /100 | #233 | Tragic 11.5% |
| Immigrants | Peru | 4.5 /100 | #234 | Tragic 11.5% |
| Kiowa | 4.0 /100 | #235 | Tragic 11.5% |
| Cree | 3.5 /100 | #236 | Tragic 11.6% |
| Ute | 3.3 /100 | #237 | Tragic 11.6% |
| Russians | 3.2 /100 | #238 | Tragic 11.6% |
| Taiwanese | 2.8 /100 | #239 | Tragic 11.7% |
| Immigrants | Immigrants | 2.7 /100 | #240 | Tragic 11.7% |
| Eastern Europeans | 2.7 /100 | #241 | Tragic 11.7% |
| Turks | 2.6 /100 | #242 | Tragic 11.7% |
| Cheyenne | 2.4 /100 | #243 | Tragic 11.7% |