Puerto Rican vs Immigrants from Korea 1 or more Vehicles in Household
COMPARE
Puerto Rican
Immigrants from Korea
1 or more Vehicles in Household
1 or more Vehicles in Household Comparison
Puerto Ricans
Immigrants from Korea
84.6%
1 OR MORE VEHICLES IN HOUSEHOLD
0.0/ 100
METRIC RATING
311th/ 347
METRIC RANK
90.5%
1 OR MORE VEHICLES IN HOUSEHOLD
90.5/ 100
METRIC RATING
125th/ 347
METRIC RANK
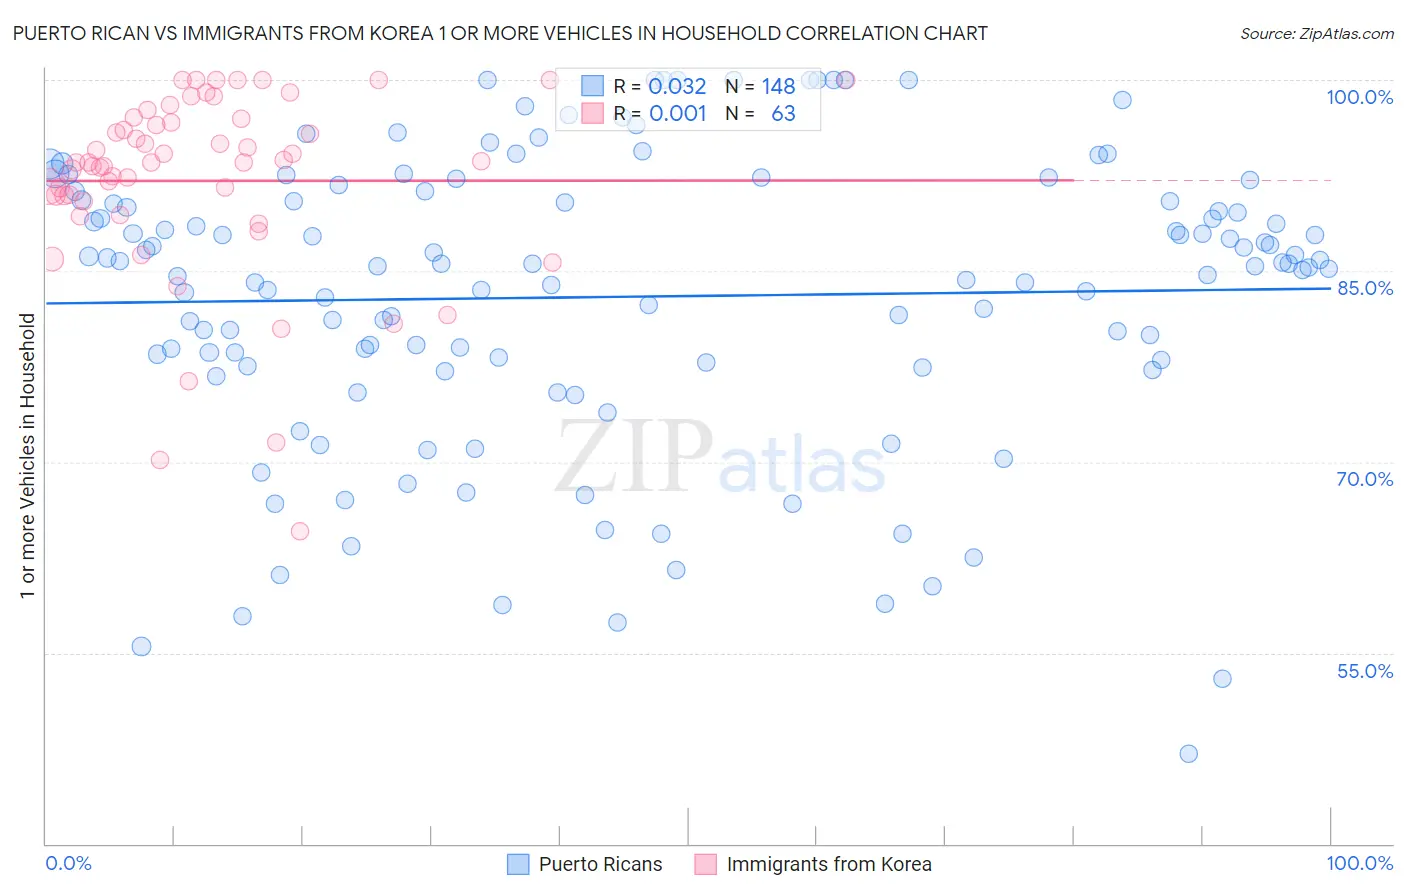
Puerto Rican vs Immigrants from Korea 1 or more Vehicles in Household Correlation Chart
The statistical analysis conducted on geographies consisting of 527,808,789 people shows no correlation between the proportion of Puerto Ricans and percentage of households with 1 or more vehicles available in the United States with a correlation coefficient (R) of 0.032 and weighted average of 84.6%. Similarly, the statistical analysis conducted on geographies consisting of 416,017,081 people shows no correlation between the proportion of Immigrants from Korea and percentage of households with 1 or more vehicles available in the United States with a correlation coefficient (R) of 0.001 and weighted average of 90.5%, a difference of 6.9%.
1 or more Vehicles in Household Correlation Summary
| Measurement | Puerto Rican | Immigrants from Korea |
| Minimum | 47.0% | 64.5% |
| Maximum | 100.0% | 100.0% |
| Range | 53.0% | 35.5% |
| Mean | 83.0% | 92.1% |
| Median | 85.3% | 93.6% |
| Interquartile 25% (IQ1) | 77.6% | 90.5% |
| Interquartile 75% (IQ3) | 90.5% | 97.0% |
| Interquartile Range (IQR) | 12.8% | 6.5% |
| Standard Deviation (Sample) | 11.4% | 7.5% |
| Standard Deviation (Population) | 11.4% | 7.4% |
Similar Demographics by 1 or more Vehicles in Household
Demographics Similar to Puerto Ricans by 1 or more Vehicles in Household
In terms of 1 or more vehicles in household, the demographic groups most similar to Puerto Ricans are U.S. Virgin Islander (84.6%, a difference of 0.040%), Immigrants from Haiti (84.7%, a difference of 0.070%), Immigrants from Belize (84.7%, a difference of 0.080%), Tohono O'odham (84.7%, a difference of 0.11%), and Cape Verdean (84.5%, a difference of 0.11%).
| Demographics | Rating | Rank | 1 or more Vehicles in Household |
| Immigrants | Ukraine | 0.0 /100 | #304 | Tragic 85.2% |
| Immigrants | China | 0.0 /100 | #305 | Tragic 84.9% |
| Immigrants | Western Africa | 0.0 /100 | #306 | Tragic 84.9% |
| Tohono O'odham | 0.0 /100 | #307 | Tragic 84.7% |
| Immigrants | Belize | 0.0 /100 | #308 | Tragic 84.7% |
| Immigrants | Haiti | 0.0 /100 | #309 | Tragic 84.7% |
| U.S. Virgin Islanders | 0.0 /100 | #310 | Tragic 84.6% |
| Puerto Ricans | 0.0 /100 | #311 | Tragic 84.6% |
| Cape Verdeans | 0.0 /100 | #312 | Tragic 84.5% |
| Immigrants | Israel | 0.0 /100 | #313 | Tragic 84.5% |
| Albanians | 0.0 /100 | #314 | Tragic 84.4% |
| Cypriots | 0.0 /100 | #315 | Tragic 84.4% |
| Alaska Natives | 0.0 /100 | #316 | Tragic 83.8% |
| Ghanaians | 0.0 /100 | #317 | Tragic 83.6% |
| Immigrants | Ghana | 0.0 /100 | #318 | Tragic 83.4% |
Demographics Similar to Immigrants from Korea by 1 or more Vehicles in Household
In terms of 1 or more vehicles in household, the demographic groups most similar to Immigrants from Korea are Puget Sound Salish (90.5%, a difference of 0.040%), Immigrants from Cameroon (90.4%, a difference of 0.050%), Fijian (90.5%, a difference of 0.060%), Immigrants from the Azores (90.4%, a difference of 0.060%), and Burmese (90.4%, a difference of 0.060%).
| Demographics | Rating | Rank | 1 or more Vehicles in Household |
| Japanese | 93.4 /100 | #118 | Exceptional 90.6% |
| Blackfeet | 92.6 /100 | #119 | Exceptional 90.6% |
| Immigrants | Thailand | 92.3 /100 | #120 | Exceptional 90.6% |
| Icelanders | 92.1 /100 | #121 | Exceptional 90.5% |
| Costa Ricans | 92.0 /100 | #122 | Exceptional 90.5% |
| Fijians | 91.8 /100 | #123 | Exceptional 90.5% |
| Puget Sound Salish | 91.5 /100 | #124 | Exceptional 90.5% |
| Immigrants | Korea | 90.5 /100 | #125 | Exceptional 90.5% |
| Immigrants | Cameroon | 89.4 /100 | #126 | Excellent 90.4% |
| Immigrants | Azores | 89.1 /100 | #127 | Excellent 90.4% |
| Burmese | 89.0 /100 | #128 | Excellent 90.4% |
| Marshallese | 88.9 /100 | #129 | Excellent 90.4% |
| Nicaraguans | 88.8 /100 | #130 | Excellent 90.4% |
| Immigrants | Kenya | 88.5 /100 | #131 | Excellent 90.4% |
| Immigrants | South Africa | 88.1 /100 | #132 | Excellent 90.4% |