Puerto Rican vs Thai 1 or more Vehicles in Household
COMPARE
Puerto Rican
Thai
1 or more Vehicles in Household
1 or more Vehicles in Household Comparison
Puerto Ricans
Thais
84.6%
1 OR MORE VEHICLES IN HOUSEHOLD
0.0/ 100
METRIC RATING
311th/ 347
METRIC RANK
91.9%
1 OR MORE VEHICLES IN HOUSEHOLD
99.8/ 100
METRIC RATING
62nd/ 347
METRIC RANK
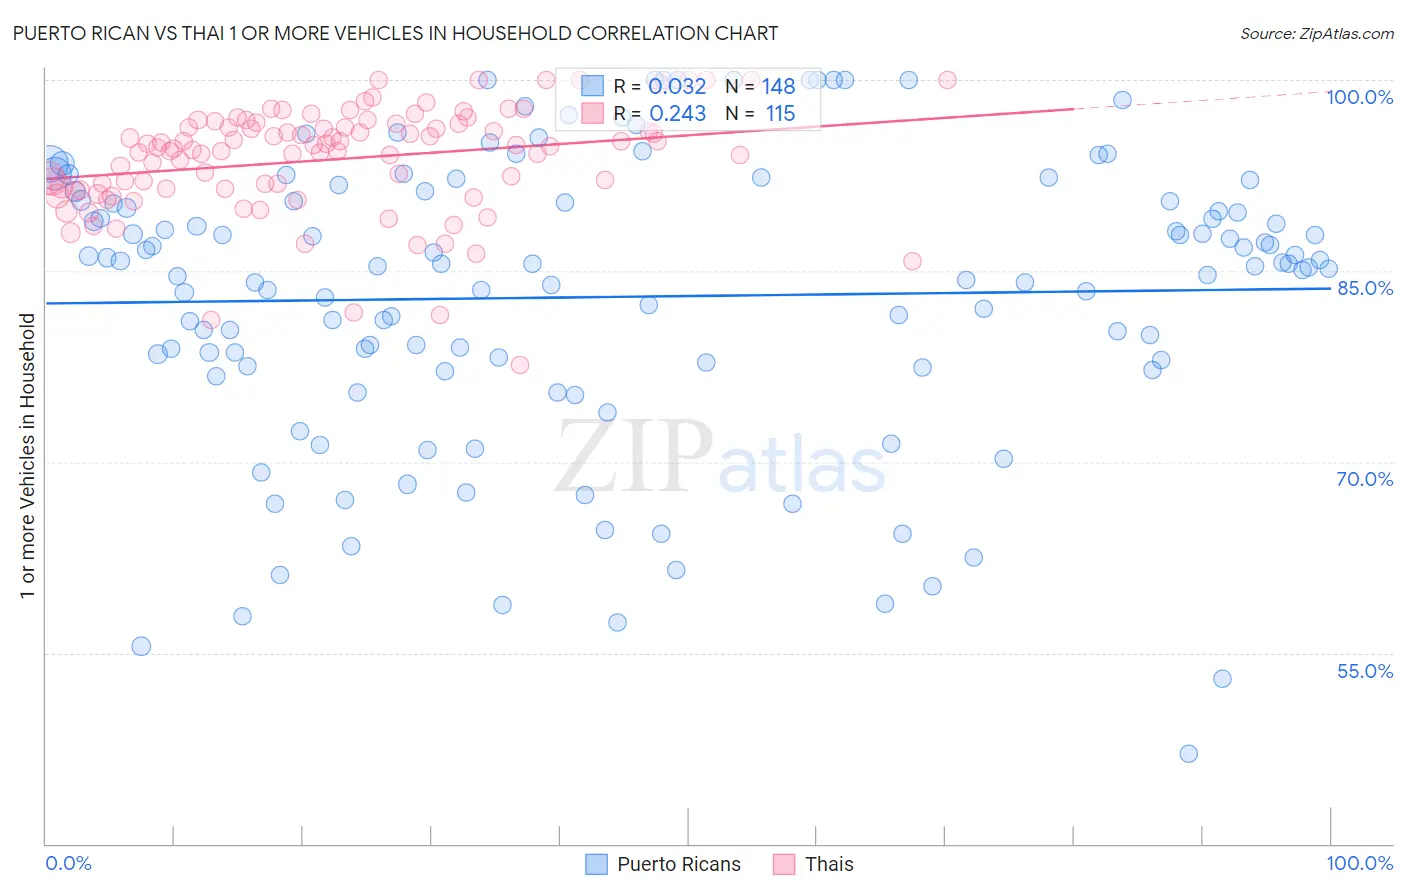
Puerto Rican vs Thai 1 or more Vehicles in Household Correlation Chart
The statistical analysis conducted on geographies consisting of 527,808,789 people shows no correlation between the proportion of Puerto Ricans and percentage of households with 1 or more vehicles available in the United States with a correlation coefficient (R) of 0.032 and weighted average of 84.6%. Similarly, the statistical analysis conducted on geographies consisting of 456,543,846 people shows a weak positive correlation between the proportion of Thais and percentage of households with 1 or more vehicles available in the United States with a correlation coefficient (R) of 0.243 and weighted average of 91.9%, a difference of 8.6%.
1 or more Vehicles in Household Correlation Summary
| Measurement | Puerto Rican | Thai |
| Minimum | 47.0% | 77.6% |
| Maximum | 100.0% | 100.0% |
| Range | 53.0% | 22.4% |
| Mean | 83.0% | 93.8% |
| Median | 85.3% | 94.7% |
| Interquartile 25% (IQ1) | 77.6% | 91.4% |
| Interquartile 75% (IQ3) | 90.5% | 96.6% |
| Interquartile Range (IQR) | 12.8% | 5.1% |
| Standard Deviation (Sample) | 11.4% | 4.2% |
| Standard Deviation (Population) | 11.4% | 4.2% |
Similar Demographics by 1 or more Vehicles in Household
Demographics Similar to Puerto Ricans by 1 or more Vehicles in Household
In terms of 1 or more vehicles in household, the demographic groups most similar to Puerto Ricans are U.S. Virgin Islander (84.6%, a difference of 0.040%), Immigrants from Haiti (84.7%, a difference of 0.070%), Immigrants from Belize (84.7%, a difference of 0.080%), Tohono O'odham (84.7%, a difference of 0.11%), and Cape Verdean (84.5%, a difference of 0.11%).
| Demographics | Rating | Rank | 1 or more Vehicles in Household |
| Immigrants | Ukraine | 0.0 /100 | #304 | Tragic 85.2% |
| Immigrants | China | 0.0 /100 | #305 | Tragic 84.9% |
| Immigrants | Western Africa | 0.0 /100 | #306 | Tragic 84.9% |
| Tohono O'odham | 0.0 /100 | #307 | Tragic 84.7% |
| Immigrants | Belize | 0.0 /100 | #308 | Tragic 84.7% |
| Immigrants | Haiti | 0.0 /100 | #309 | Tragic 84.7% |
| U.S. Virgin Islanders | 0.0 /100 | #310 | Tragic 84.6% |
| Puerto Ricans | 0.0 /100 | #311 | Tragic 84.6% |
| Cape Verdeans | 0.0 /100 | #312 | Tragic 84.5% |
| Immigrants | Israel | 0.0 /100 | #313 | Tragic 84.5% |
| Albanians | 0.0 /100 | #314 | Tragic 84.4% |
| Cypriots | 0.0 /100 | #315 | Tragic 84.4% |
| Alaska Natives | 0.0 /100 | #316 | Tragic 83.8% |
| Ghanaians | 0.0 /100 | #317 | Tragic 83.6% |
| Immigrants | Ghana | 0.0 /100 | #318 | Tragic 83.4% |
Demographics Similar to Thais by 1 or more Vehicles in Household
In terms of 1 or more vehicles in household, the demographic groups most similar to Thais are Immigrants from India (91.9%, a difference of 0.0%), Slovak (91.9%, a difference of 0.020%), Chinese (91.9%, a difference of 0.020%), Croatian (91.9%, a difference of 0.030%), and Venezuelan (91.9%, a difference of 0.040%).
| Demographics | Rating | Rank | 1 or more Vehicles in Household |
| Immigrants | Afghanistan | 99.9 /100 | #55 | Exceptional 92.0% |
| Immigrants | Venezuela | 99.9 /100 | #56 | Exceptional 92.0% |
| Iraqis | 99.8 /100 | #57 | Exceptional 91.9% |
| Immigrants | Mexico | 99.8 /100 | #58 | Exceptional 91.9% |
| Venezuelans | 99.8 /100 | #59 | Exceptional 91.9% |
| Slovaks | 99.8 /100 | #60 | Exceptional 91.9% |
| Immigrants | India | 99.8 /100 | #61 | Exceptional 91.9% |
| Thais | 99.8 /100 | #62 | Exceptional 91.9% |
| Chinese | 99.8 /100 | #63 | Exceptional 91.9% |
| Croatians | 99.8 /100 | #64 | Exceptional 91.9% |
| Immigrants | Laos | 99.8 /100 | #65 | Exceptional 91.8% |
| Canadians | 99.8 /100 | #66 | Exceptional 91.8% |
| Spaniards | 99.8 /100 | #67 | Exceptional 91.8% |
| Immigrants | Scotland | 99.7 /100 | #68 | Exceptional 91.8% |
| Palestinians | 99.7 /100 | #69 | Exceptional 91.7% |