Puerto Rican vs Immigrants from Korea No Schooling Completed
COMPARE
Puerto Rican
Immigrants from Korea
No Schooling Completed
No Schooling Completed Comparison
Puerto Ricans
Immigrants from Korea
2.3%
NO SCHOOLING COMPLETED
3.4/ 100
METRIC RATING
230th/ 347
METRIC RANK
2.0%
NO SCHOOLING COMPLETED
66.7/ 100
METRIC RATING
158th/ 347
METRIC RANK
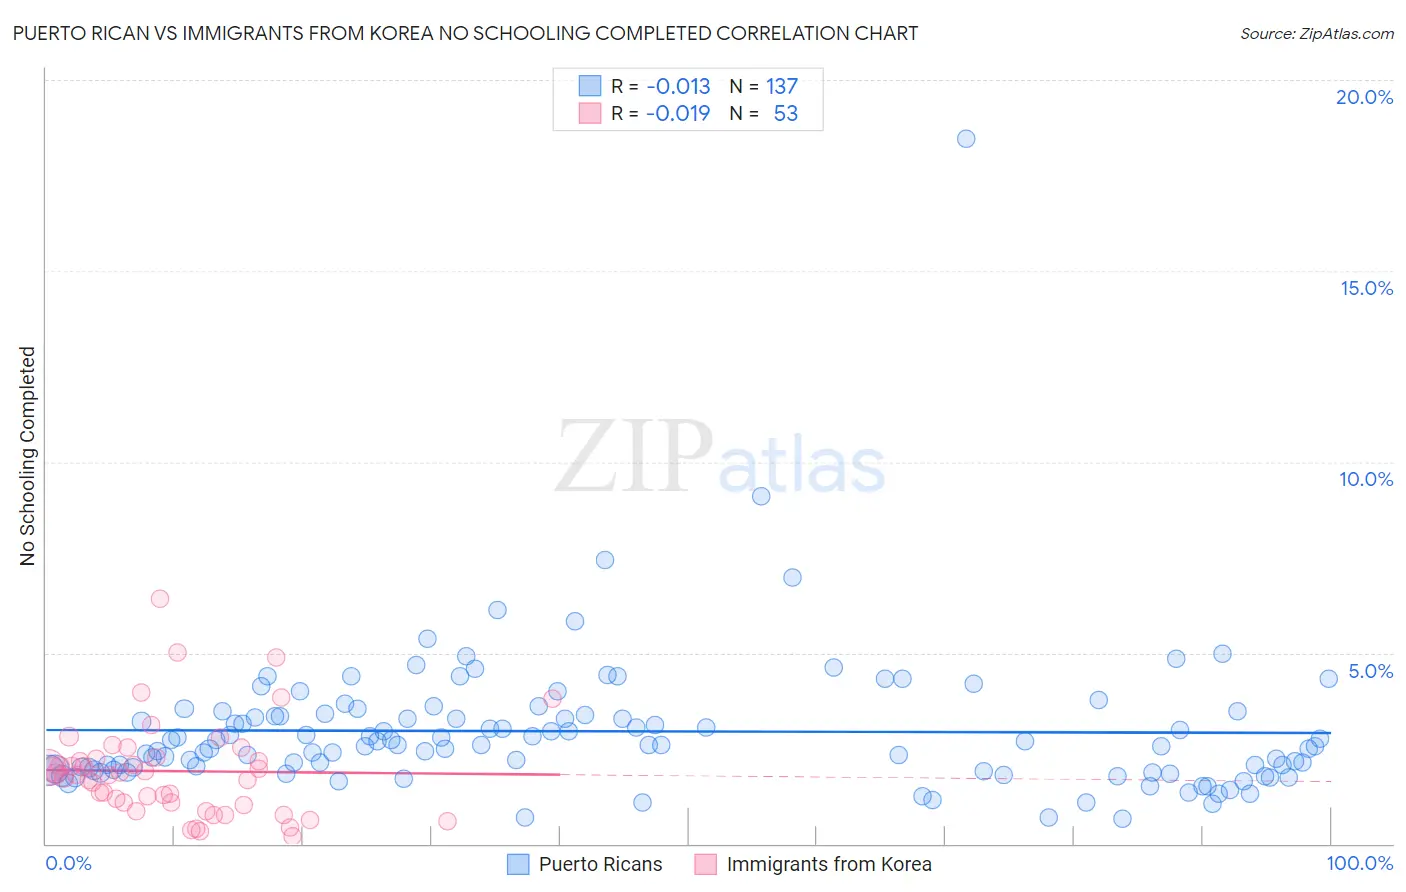
Puerto Rican vs Immigrants from Korea No Schooling Completed Correlation Chart
The statistical analysis conducted on geographies consisting of 518,442,675 people shows no correlation between the proportion of Puerto Ricans and percentage of population with no schooling in the United States with a correlation coefficient (R) of -0.013 and weighted average of 2.3%. Similarly, the statistical analysis conducted on geographies consisting of 411,278,726 people shows no correlation between the proportion of Immigrants from Korea and percentage of population with no schooling in the United States with a correlation coefficient (R) of -0.019 and weighted average of 2.0%, a difference of 13.9%.
No Schooling Completed Correlation Summary
| Measurement | Puerto Rican | Immigrants from Korea |
| Minimum | 0.67% | 0.20% |
| Maximum | 18.5% | 6.4% |
| Range | 17.8% | 6.2% |
| Mean | 2.9% | 1.9% |
| Median | 2.6% | 1.8% |
| Interquartile 25% (IQ1) | 1.9% | 1.0% |
| Interquartile 75% (IQ3) | 3.4% | 2.2% |
| Interquartile Range (IQR) | 1.5% | 1.2% |
| Standard Deviation (Sample) | 1.9% | 1.3% |
| Standard Deviation (Population) | 1.9% | 1.2% |
Similar Demographics by No Schooling Completed
Demographics Similar to Puerto Ricans by No Schooling Completed
In terms of no schooling completed, the demographic groups most similar to Puerto Ricans are Immigrants from Uruguay (2.3%, a difference of 0.020%), Immigrants from Pakistan (2.3%, a difference of 0.13%), U.S. Virgin Islander (2.3%, a difference of 0.22%), Colombian (2.3%, a difference of 0.25%), and Immigrants from Uganda (2.3%, a difference of 0.51%).
| Demographics | Rating | Rank | No Schooling Completed |
| Immigrants | Lebanon | 4.5 /100 | #223 | Tragic 2.3% |
| Tohono O'odham | 4.1 /100 | #224 | Tragic 2.3% |
| Sudanese | 4.1 /100 | #225 | Tragic 2.3% |
| Sierra Leoneans | 4.1 /100 | #226 | Tragic 2.3% |
| Immigrants | Uganda | 4.0 /100 | #227 | Tragic 2.3% |
| U.S. Virgin Islanders | 3.7 /100 | #228 | Tragic 2.3% |
| Immigrants | Pakistan | 3.6 /100 | #229 | Tragic 2.3% |
| Puerto Ricans | 3.4 /100 | #230 | Tragic 2.3% |
| Immigrants | Uruguay | 3.4 /100 | #231 | Tragic 2.3% |
| Colombians | 3.2 /100 | #232 | Tragic 2.3% |
| Immigrants | Malaysia | 2.8 /100 | #233 | Tragic 2.3% |
| Nigerians | 2.6 /100 | #234 | Tragic 2.3% |
| Immigrants | Western Asia | 2.6 /100 | #235 | Tragic 2.3% |
| Iraqis | 2.2 /100 | #236 | Tragic 2.4% |
| Immigrants | Eastern Asia | 2.0 /100 | #237 | Tragic 2.4% |
Demographics Similar to Immigrants from Korea by No Schooling Completed
In terms of no schooling completed, the demographic groups most similar to Immigrants from Korea are Immigrants from Sri Lanka (2.0%, a difference of 0.040%), Immigrants from Spain (2.0%, a difference of 0.050%), Chilean (2.0%, a difference of 0.080%), Immigrants from Russia (2.0%, a difference of 0.14%), and Kenyan (2.0%, a difference of 0.16%).
| Demographics | Rating | Rank | No Schooling Completed |
| Immigrants | Jordan | 70.9 /100 | #151 | Good 2.0% |
| Immigrants | Eastern Europe | 70.4 /100 | #152 | Good 2.0% |
| Immigrants | Italy | 68.9 /100 | #153 | Good 2.0% |
| Immigrants | Venezuela | 68.5 /100 | #154 | Good 2.0% |
| Immigrants | Russia | 67.6 /100 | #155 | Good 2.0% |
| Chileans | 67.2 /100 | #156 | Good 2.0% |
| Immigrants | Sri Lanka | 67.0 /100 | #157 | Good 2.0% |
| Immigrants | Korea | 66.7 /100 | #158 | Good 2.0% |
| Immigrants | Spain | 66.4 /100 | #159 | Good 2.0% |
| Kenyans | 65.7 /100 | #160 | Good 2.0% |
| Ugandans | 64.6 /100 | #161 | Good 2.0% |
| Immigrants | Brazil | 63.8 /100 | #162 | Good 2.1% |
| Albanians | 62.2 /100 | #163 | Good 2.1% |
| Comanche | 60.7 /100 | #164 | Good 2.1% |
| Brazilians | 60.2 /100 | #165 | Good 2.1% |