Puerto Rican vs Immigrants from Korea In Labor Force | Age 30-34
COMPARE
Puerto Rican
Immigrants from Korea
In Labor Force | Age 30-34
In Labor Force | Age 30-34 Comparison
Puerto Ricans
Immigrants from Korea
81.2%
IN LABOR FORCE | AGE 30-34
0.0/ 100
METRIC RATING
322nd/ 347
METRIC RANK
85.2%
IN LABOR FORCE | AGE 30-34
97.3/ 100
METRIC RATING
96th/ 347
METRIC RANK
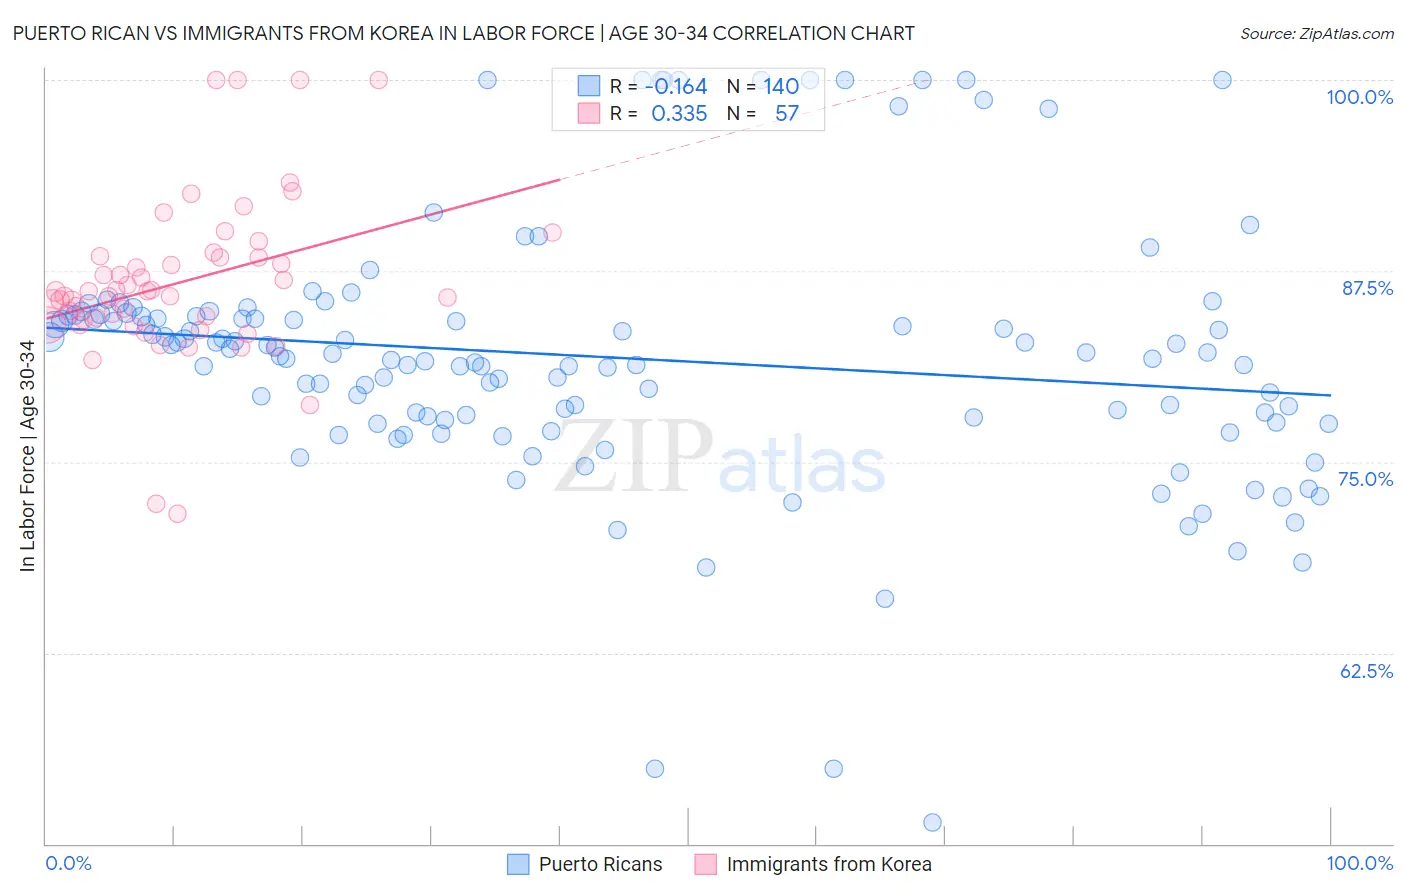
Puerto Rican vs Immigrants from Korea In Labor Force | Age 30-34 Correlation Chart
The statistical analysis conducted on geographies consisting of 527,590,157 people shows a poor negative correlation between the proportion of Puerto Ricans and labor force participation rate among population between the ages 30 and 34 in the United States with a correlation coefficient (R) of -0.164 and weighted average of 81.2%. Similarly, the statistical analysis conducted on geographies consisting of 416,066,569 people shows a mild positive correlation between the proportion of Immigrants from Korea and labor force participation rate among population between the ages 30 and 34 in the United States with a correlation coefficient (R) of 0.335 and weighted average of 85.2%, a difference of 4.9%.
In Labor Force | Age 30-34 Correlation Summary
| Measurement | Puerto Rican | Immigrants from Korea |
| Minimum | 51.4% | 71.6% |
| Maximum | 100.0% | 100.0% |
| Range | 48.6% | 28.4% |
| Mean | 81.9% | 86.8% |
| Median | 82.0% | 86.2% |
| Interquartile 25% (IQ1) | 77.8% | 84.1% |
| Interquartile 75% (IQ3) | 84.6% | 88.4% |
| Interquartile Range (IQR) | 6.8% | 4.3% |
| Standard Deviation (Sample) | 8.5% | 5.3% |
| Standard Deviation (Population) | 8.4% | 5.3% |
Similar Demographics by In Labor Force | Age 30-34
Demographics Similar to Puerto Ricans by In Labor Force | Age 30-34
In terms of in labor force | age 30-34, the demographic groups most similar to Puerto Ricans are Paiute (81.2%, a difference of 0.050%), Cheyenne (81.1%, a difference of 0.080%), Alaska Native (81.3%, a difference of 0.16%), Dutch West Indian (81.0%, a difference of 0.23%), and Yaqui (81.4%, a difference of 0.24%).
| Demographics | Rating | Rank | In Labor Force | Age 30-34 |
| Cherokee | 0.0 /100 | #315 | Tragic 81.6% |
| Immigrants | Azores | 0.0 /100 | #316 | Tragic 81.5% |
| Arapaho | 0.0 /100 | #317 | Tragic 81.5% |
| Choctaw | 0.0 /100 | #318 | Tragic 81.4% |
| Shoshone | 0.0 /100 | #319 | Tragic 81.4% |
| Yaqui | 0.0 /100 | #320 | Tragic 81.4% |
| Alaska Natives | 0.0 /100 | #321 | Tragic 81.3% |
| Puerto Ricans | 0.0 /100 | #322 | Tragic 81.2% |
| Paiute | 0.0 /100 | #323 | Tragic 81.2% |
| Cheyenne | 0.0 /100 | #324 | Tragic 81.1% |
| Dutch West Indians | 0.0 /100 | #325 | Tragic 81.0% |
| Seminole | 0.0 /100 | #326 | Tragic 80.8% |
| Colville | 0.0 /100 | #327 | Tragic 80.7% |
| Sioux | 0.0 /100 | #328 | Tragic 80.4% |
| Creek | 0.0 /100 | #329 | Tragic 80.4% |
Demographics Similar to Immigrants from Korea by In Labor Force | Age 30-34
In terms of in labor force | age 30-34, the demographic groups most similar to Immigrants from Korea are Thai (85.2%, a difference of 0.0%), Immigrants from Uganda (85.2%, a difference of 0.0%), Swedish (85.2%, a difference of 0.010%), Immigrants from India (85.2%, a difference of 0.010%), and Belgian (85.2%, a difference of 0.010%).
| Demographics | Rating | Rank | In Labor Force | Age 30-34 |
| Immigrants | Kazakhstan | 98.1 /100 | #89 | Exceptional 85.3% |
| Burmese | 97.9 /100 | #90 | Exceptional 85.3% |
| Immigrants | Moldova | 97.9 /100 | #91 | Exceptional 85.3% |
| German Russians | 97.7 /100 | #92 | Exceptional 85.2% |
| Immigrants | Norway | 97.6 /100 | #93 | Exceptional 85.2% |
| Swedes | 97.5 /100 | #94 | Exceptional 85.2% |
| Immigrants | India | 97.4 /100 | #95 | Exceptional 85.2% |
| Immigrants | Korea | 97.3 /100 | #96 | Exceptional 85.2% |
| Thais | 97.2 /100 | #97 | Exceptional 85.2% |
| Immigrants | Uganda | 97.2 /100 | #98 | Exceptional 85.2% |
| Belgians | 97.2 /100 | #99 | Exceptional 85.2% |
| Sudanese | 97.1 /100 | #100 | Exceptional 85.2% |
| Immigrants | Belarus | 96.9 /100 | #101 | Exceptional 85.2% |
| Immigrants | Austria | 96.8 /100 | #102 | Exceptional 85.2% |
| Ukrainians | 96.6 /100 | #103 | Exceptional 85.2% |