Inupiat vs Immigrants from Korea 1 or more Vehicles in Household
COMPARE
Inupiat
Immigrants from Korea
1 or more Vehicles in Household
1 or more Vehicles in Household Comparison
Inupiat
Immigrants from Korea
71.5%
1 OR MORE VEHICLES IN HOUSEHOLD
0.0/ 100
METRIC RATING
338th/ 347
METRIC RANK
90.5%
1 OR MORE VEHICLES IN HOUSEHOLD
90.5/ 100
METRIC RATING
125th/ 347
METRIC RANK
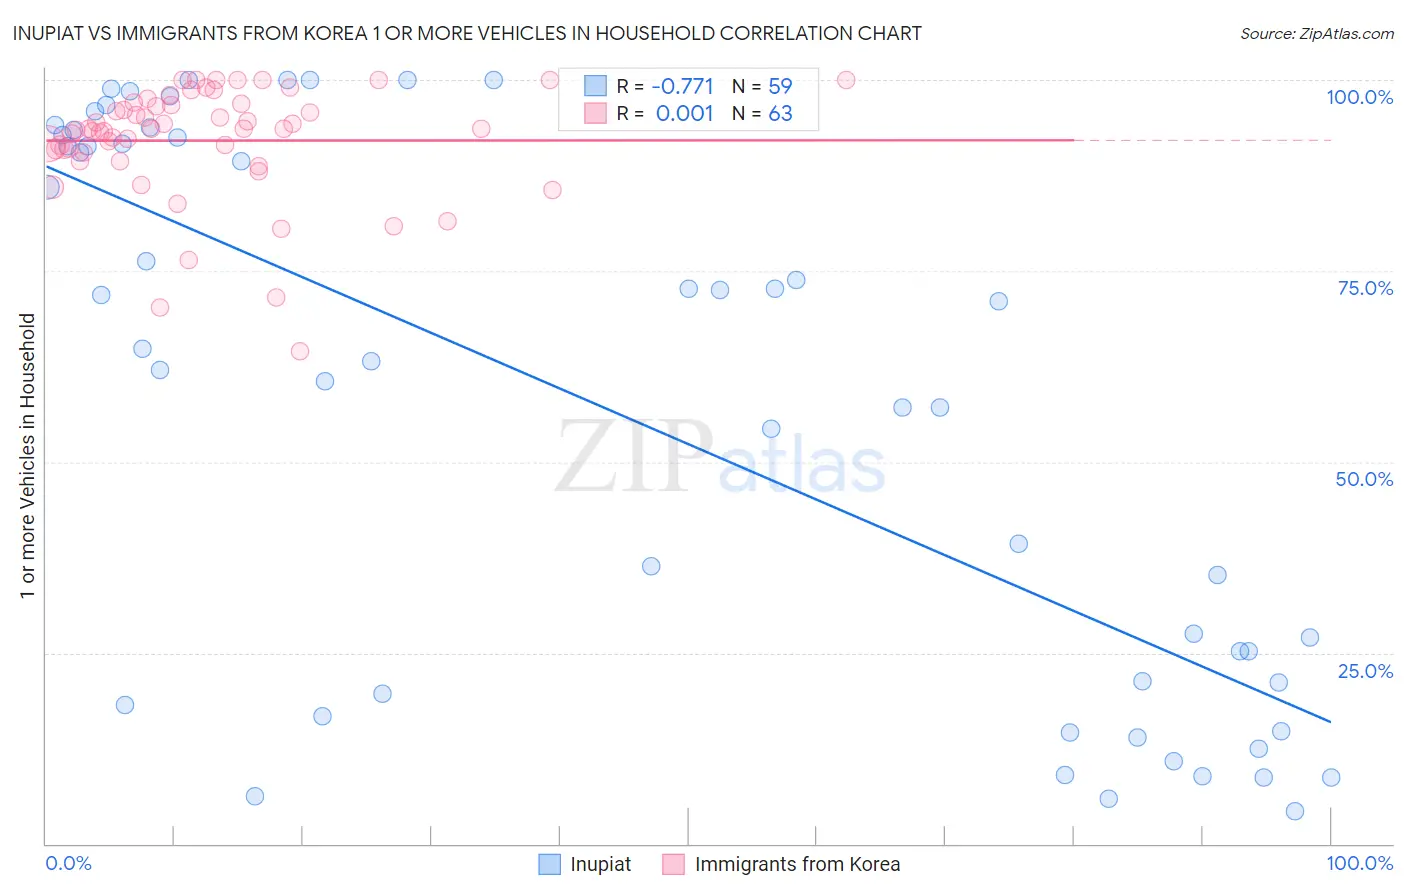
Inupiat vs Immigrants from Korea 1 or more Vehicles in Household Correlation Chart
The statistical analysis conducted on geographies consisting of 96,318,712 people shows a strong negative correlation between the proportion of Inupiat and percentage of households with 1 or more vehicles available in the United States with a correlation coefficient (R) of -0.771 and weighted average of 71.5%. Similarly, the statistical analysis conducted on geographies consisting of 416,017,081 people shows no correlation between the proportion of Immigrants from Korea and percentage of households with 1 or more vehicles available in the United States with a correlation coefficient (R) of 0.001 and weighted average of 90.5%, a difference of 26.5%.
1 or more Vehicles in Household Correlation Summary
| Measurement | Inupiat | Immigrants from Korea |
| Minimum | 4.2% | 64.5% |
| Maximum | 100.0% | 100.0% |
| Range | 95.8% | 35.5% |
| Mean | 56.9% | 92.1% |
| Median | 63.2% | 93.6% |
| Interquartile 25% (IQ1) | 19.7% | 90.5% |
| Interquartile 75% (IQ3) | 92.5% | 97.0% |
| Interquartile Range (IQR) | 72.8% | 6.5% |
| Standard Deviation (Sample) | 35.1% | 7.5% |
| Standard Deviation (Population) | 34.8% | 7.4% |
Similar Demographics by 1 or more Vehicles in Household
Demographics Similar to Inupiat by 1 or more Vehicles in Household
In terms of 1 or more vehicles in household, the demographic groups most similar to Inupiat are Guyanese (70.8%, a difference of 1.0%), Dominican (70.7%, a difference of 1.2%), Immigrants from Barbados (70.6%, a difference of 1.3%), Immigrants from Guyana (70.6%, a difference of 1.4%), and British West Indian (70.4%, a difference of 1.7%).
| Demographics | Rating | Rank | 1 or more Vehicles in Household |
| West Indians | 0.0 /100 | #331 | Tragic 76.4% |
| Trinidadians and Tobagonians | 0.0 /100 | #332 | Tragic 76.3% |
| Immigrants | Ecuador | 0.0 /100 | #333 | Tragic 76.2% |
| Immigrants | Bangladesh | 0.0 /100 | #334 | Tragic 74.3% |
| Barbadians | 0.0 /100 | #335 | Tragic 74.0% |
| Vietnamese | 0.0 /100 | #336 | Tragic 73.8% |
| Immigrants | Uzbekistan | 0.0 /100 | #337 | Tragic 73.4% |
| Inupiat | 0.0 /100 | #338 | Tragic 71.5% |
| Guyanese | 0.0 /100 | #339 | Tragic 70.8% |
| Dominicans | 0.0 /100 | #340 | Tragic 70.7% |
| Immigrants | Barbados | 0.0 /100 | #341 | Tragic 70.6% |
| Immigrants | Guyana | 0.0 /100 | #342 | Tragic 70.6% |
| British West Indians | 0.0 /100 | #343 | Tragic 70.4% |
| Immigrants | Dominican Republic | 0.0 /100 | #344 | Tragic 68.6% |
| Immigrants | St. Vincent and the Grenadines | 0.0 /100 | #345 | Tragic 64.7% |
Demographics Similar to Immigrants from Korea by 1 or more Vehicles in Household
In terms of 1 or more vehicles in household, the demographic groups most similar to Immigrants from Korea are Puget Sound Salish (90.5%, a difference of 0.040%), Immigrants from Cameroon (90.4%, a difference of 0.050%), Fijian (90.5%, a difference of 0.060%), Immigrants from the Azores (90.4%, a difference of 0.060%), and Burmese (90.4%, a difference of 0.060%).
| Demographics | Rating | Rank | 1 or more Vehicles in Household |
| Japanese | 93.4 /100 | #118 | Exceptional 90.6% |
| Blackfeet | 92.6 /100 | #119 | Exceptional 90.6% |
| Immigrants | Thailand | 92.3 /100 | #120 | Exceptional 90.6% |
| Icelanders | 92.1 /100 | #121 | Exceptional 90.5% |
| Costa Ricans | 92.0 /100 | #122 | Exceptional 90.5% |
| Fijians | 91.8 /100 | #123 | Exceptional 90.5% |
| Puget Sound Salish | 91.5 /100 | #124 | Exceptional 90.5% |
| Immigrants | Korea | 90.5 /100 | #125 | Exceptional 90.5% |
| Immigrants | Cameroon | 89.4 /100 | #126 | Excellent 90.4% |
| Immigrants | Azores | 89.1 /100 | #127 | Excellent 90.4% |
| Burmese | 89.0 /100 | #128 | Excellent 90.4% |
| Marshallese | 88.9 /100 | #129 | Excellent 90.4% |
| Nicaraguans | 88.8 /100 | #130 | Excellent 90.4% |
| Immigrants | Kenya | 88.5 /100 | #131 | Excellent 90.4% |
| Immigrants | South Africa | 88.1 /100 | #132 | Excellent 90.4% |