Croatian vs Immigrants from Korea 1 or more Vehicles in Household
COMPARE
Croatian
Immigrants from Korea
1 or more Vehicles in Household
1 or more Vehicles in Household Comparison
Croatians
Immigrants from Korea
91.9%
1 OR MORE VEHICLES IN HOUSEHOLD
99.8/ 100
METRIC RATING
64th/ 347
METRIC RANK
90.5%
1 OR MORE VEHICLES IN HOUSEHOLD
90.5/ 100
METRIC RATING
125th/ 347
METRIC RANK
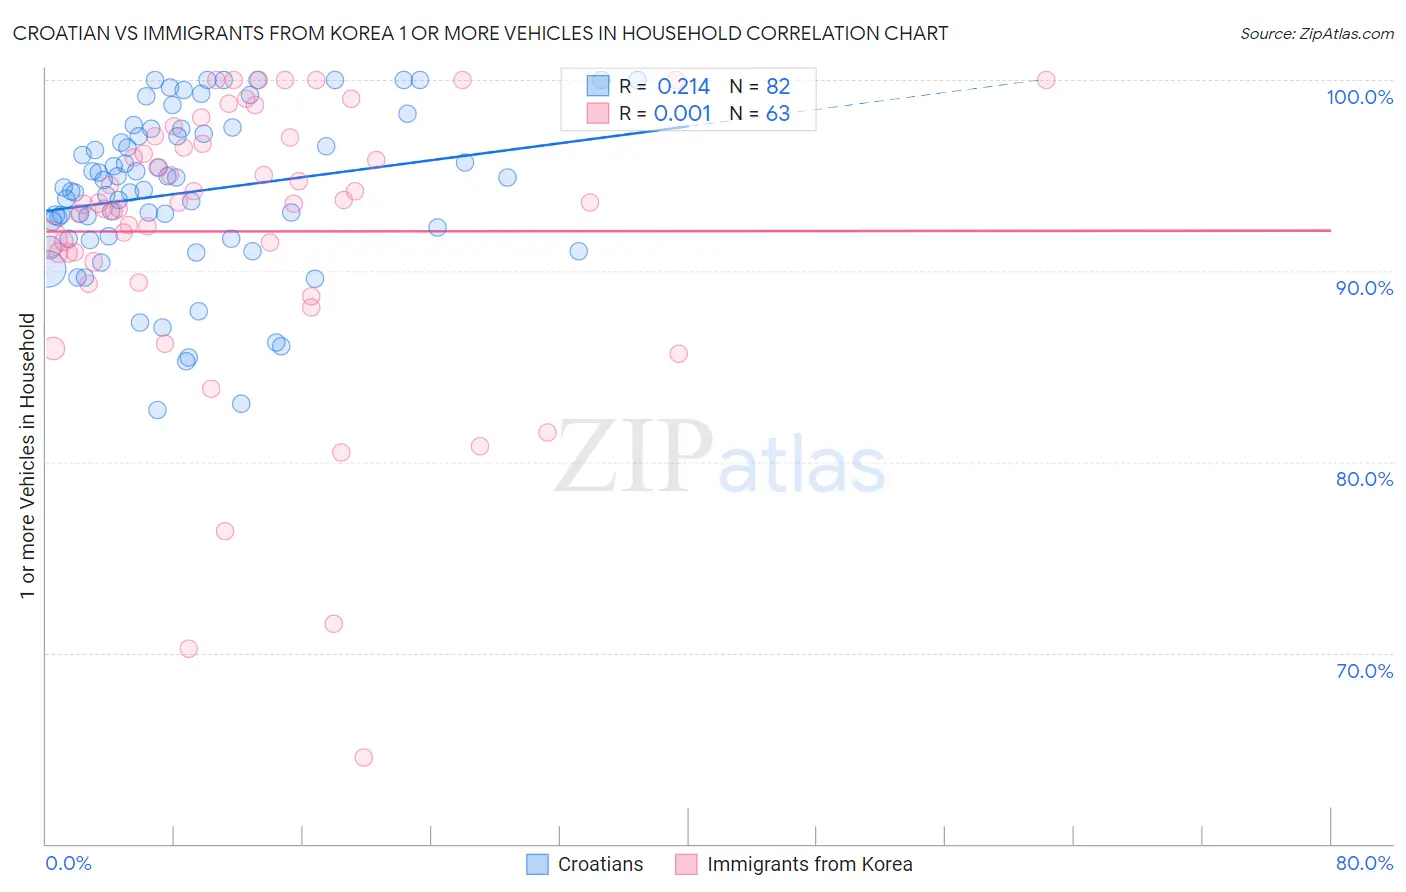
Croatian vs Immigrants from Korea 1 or more Vehicles in Household Correlation Chart
The statistical analysis conducted on geographies consisting of 375,584,731 people shows a weak positive correlation between the proportion of Croatians and percentage of households with 1 or more vehicles available in the United States with a correlation coefficient (R) of 0.214 and weighted average of 91.9%. Similarly, the statistical analysis conducted on geographies consisting of 416,017,081 people shows no correlation between the proportion of Immigrants from Korea and percentage of households with 1 or more vehicles available in the United States with a correlation coefficient (R) of 0.001 and weighted average of 90.5%, a difference of 1.5%.
1 or more Vehicles in Household Correlation Summary
| Measurement | Croatian | Immigrants from Korea |
| Minimum | 82.7% | 64.5% |
| Maximum | 100.0% | 100.0% |
| Range | 17.3% | 35.5% |
| Mean | 94.1% | 92.1% |
| Median | 94.3% | 93.6% |
| Interquartile 25% (IQ1) | 91.7% | 90.5% |
| Interquartile 75% (IQ3) | 97.2% | 97.0% |
| Interquartile Range (IQR) | 5.5% | 6.5% |
| Standard Deviation (Sample) | 4.2% | 7.5% |
| Standard Deviation (Population) | 4.2% | 7.4% |
Similar Demographics by 1 or more Vehicles in Household
Demographics Similar to Croatians by 1 or more Vehicles in Household
In terms of 1 or more vehicles in household, the demographic groups most similar to Croatians are Chinese (91.9%, a difference of 0.010%), Immigrants from India (91.9%, a difference of 0.030%), Thai (91.9%, a difference of 0.030%), Immigrants from Laos (91.8%, a difference of 0.030%), and Slovak (91.9%, a difference of 0.050%).
| Demographics | Rating | Rank | 1 or more Vehicles in Household |
| Iraqis | 99.8 /100 | #57 | Exceptional 91.9% |
| Immigrants | Mexico | 99.8 /100 | #58 | Exceptional 91.9% |
| Venezuelans | 99.8 /100 | #59 | Exceptional 91.9% |
| Slovaks | 99.8 /100 | #60 | Exceptional 91.9% |
| Immigrants | India | 99.8 /100 | #61 | Exceptional 91.9% |
| Thais | 99.8 /100 | #62 | Exceptional 91.9% |
| Chinese | 99.8 /100 | #63 | Exceptional 91.9% |
| Croatians | 99.8 /100 | #64 | Exceptional 91.9% |
| Immigrants | Laos | 99.8 /100 | #65 | Exceptional 91.8% |
| Canadians | 99.8 /100 | #66 | Exceptional 91.8% |
| Spaniards | 99.8 /100 | #67 | Exceptional 91.8% |
| Immigrants | Scotland | 99.7 /100 | #68 | Exceptional 91.8% |
| Palestinians | 99.7 /100 | #69 | Exceptional 91.7% |
| Lithuanians | 99.7 /100 | #70 | Exceptional 91.7% |
| Poles | 99.7 /100 | #71 | Exceptional 91.7% |
Demographics Similar to Immigrants from Korea by 1 or more Vehicles in Household
In terms of 1 or more vehicles in household, the demographic groups most similar to Immigrants from Korea are Puget Sound Salish (90.5%, a difference of 0.040%), Immigrants from Cameroon (90.4%, a difference of 0.050%), Fijian (90.5%, a difference of 0.060%), Immigrants from the Azores (90.4%, a difference of 0.060%), and Burmese (90.4%, a difference of 0.060%).
| Demographics | Rating | Rank | 1 or more Vehicles in Household |
| Japanese | 93.4 /100 | #118 | Exceptional 90.6% |
| Blackfeet | 92.6 /100 | #119 | Exceptional 90.6% |
| Immigrants | Thailand | 92.3 /100 | #120 | Exceptional 90.6% |
| Icelanders | 92.1 /100 | #121 | Exceptional 90.5% |
| Costa Ricans | 92.0 /100 | #122 | Exceptional 90.5% |
| Fijians | 91.8 /100 | #123 | Exceptional 90.5% |
| Puget Sound Salish | 91.5 /100 | #124 | Exceptional 90.5% |
| Immigrants | Korea | 90.5 /100 | #125 | Exceptional 90.5% |
| Immigrants | Cameroon | 89.4 /100 | #126 | Excellent 90.4% |
| Immigrants | Azores | 89.1 /100 | #127 | Excellent 90.4% |
| Burmese | 89.0 /100 | #128 | Excellent 90.4% |
| Marshallese | 88.9 /100 | #129 | Excellent 90.4% |
| Nicaraguans | 88.8 /100 | #130 | Excellent 90.4% |
| Immigrants | Kenya | 88.5 /100 | #131 | Excellent 90.4% |
| Immigrants | South Africa | 88.1 /100 | #132 | Excellent 90.4% |