Puerto Rican vs Immigrants from Korea Ambulatory Disability
COMPARE
Puerto Rican
Immigrants from Korea
Ambulatory Disability
Ambulatory Disability Comparison
Puerto Ricans
Immigrants from Korea
8.9%
AMBULATORY DISABILITY
0.0/ 100
METRIC RATING
345th/ 347
METRIC RANK
5.2%
AMBULATORY DISABILITY
100.0/ 100
METRIC RATING
11th/ 347
METRIC RANK
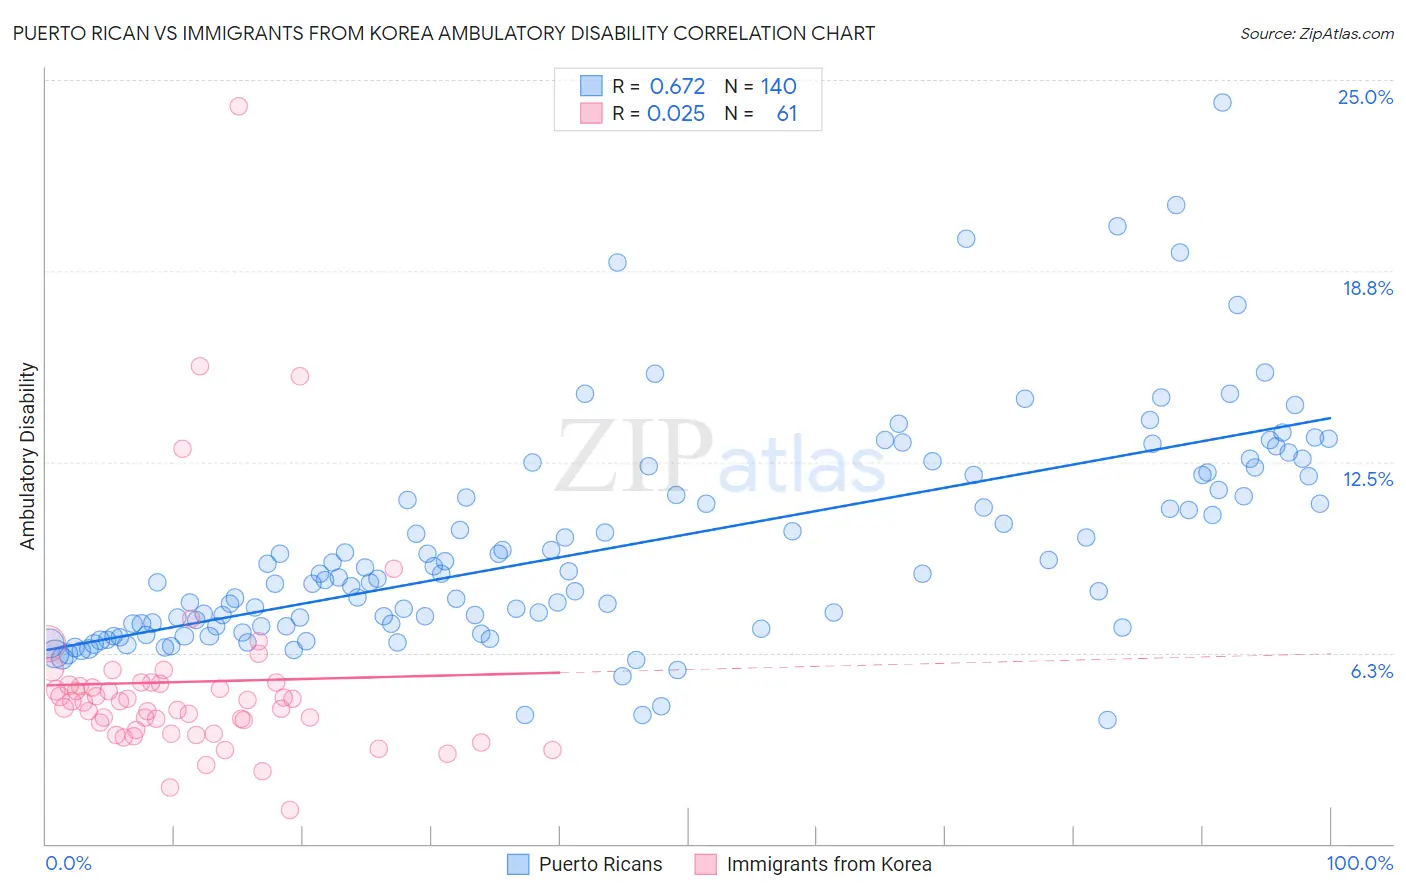
Puerto Rican vs Immigrants from Korea Ambulatory Disability Correlation Chart
The statistical analysis conducted on geographies consisting of 527,889,782 people shows a significant positive correlation between the proportion of Puerto Ricans and percentage of population with ambulatory disability in the United States with a correlation coefficient (R) of 0.672 and weighted average of 8.9%. Similarly, the statistical analysis conducted on geographies consisting of 416,118,040 people shows no correlation between the proportion of Immigrants from Korea and percentage of population with ambulatory disability in the United States with a correlation coefficient (R) of 0.025 and weighted average of 5.2%, a difference of 69.3%.
Ambulatory Disability Correlation Summary
| Measurement | Puerto Rican | Immigrants from Korea |
| Minimum | 4.0% | 1.1% |
| Maximum | 24.3% | 24.1% |
| Range | 20.2% | 23.0% |
| Mean | 9.7% | 5.3% |
| Median | 8.7% | 4.6% |
| Interquartile 25% (IQ1) | 7.1% | 3.7% |
| Interquartile 75% (IQ3) | 11.8% | 5.2% |
| Interquartile Range (IQR) | 4.7% | 1.6% |
| Standard Deviation (Sample) | 3.6% | 3.5% |
| Standard Deviation (Population) | 3.6% | 3.5% |
Similar Demographics by Ambulatory Disability
Demographics Similar to Puerto Ricans by Ambulatory Disability
In terms of ambulatory disability, the demographic groups most similar to Puerto Ricans are Tsimshian (8.8%, a difference of 0.59%), Tohono O'odham (8.7%, a difference of 1.6%), Kiowa (8.6%, a difference of 3.1%), Houma (9.3%, a difference of 4.9%), and Creek (8.5%, a difference of 5.0%).
| Demographics | Rating | Rank | Ambulatory Disability |
| Cherokee | 0.0 /100 | #333 | Tragic 7.9% |
| Yuman | 0.0 /100 | #334 | Tragic 7.9% |
| Chickasaw | 0.0 /100 | #335 | Tragic 8.0% |
| Seminole | 0.0 /100 | #336 | Tragic 8.0% |
| Dutch West Indians | 0.0 /100 | #337 | Tragic 8.2% |
| Colville | 0.0 /100 | #338 | Tragic 8.2% |
| Pima | 0.0 /100 | #339 | Tragic 8.2% |
| Choctaw | 0.0 /100 | #340 | Tragic 8.3% |
| Creek | 0.0 /100 | #341 | Tragic 8.5% |
| Kiowa | 0.0 /100 | #342 | Tragic 8.6% |
| Tohono O'odham | 0.0 /100 | #343 | Tragic 8.7% |
| Tsimshian | 0.0 /100 | #344 | Tragic 8.8% |
| Puerto Ricans | 0.0 /100 | #345 | Tragic 8.9% |
| Houma | 0.0 /100 | #346 | Tragic 9.3% |
| Lumbee | 0.0 /100 | #347 | Tragic 9.5% |
Demographics Similar to Immigrants from Korea by Ambulatory Disability
In terms of ambulatory disability, the demographic groups most similar to Immigrants from Korea are Okinawan (5.3%, a difference of 0.31%), Burmese (5.3%, a difference of 0.81%), Immigrants from Eastern Asia (5.3%, a difference of 0.96%), Immigrants from China (5.3%, a difference of 1.3%), and Yup'ik (5.2%, a difference of 1.6%).
| Demographics | Rating | Rank | Ambulatory Disability |
| Immigrants | Taiwan | 100.0 /100 | #4 | Exceptional 4.9% |
| Immigrants | Singapore | 100.0 /100 | #5 | Exceptional 5.0% |
| Immigrants | Bolivia | 100.0 /100 | #6 | Exceptional 5.0% |
| Bolivians | 100.0 /100 | #7 | Exceptional 5.1% |
| Immigrants | South Central Asia | 100.0 /100 | #8 | Exceptional 5.1% |
| Iranians | 100.0 /100 | #9 | Exceptional 5.1% |
| Yup'ik | 100.0 /100 | #10 | Exceptional 5.2% |
| Immigrants | Korea | 100.0 /100 | #11 | Exceptional 5.2% |
| Okinawans | 100.0 /100 | #12 | Exceptional 5.3% |
| Burmese | 100.0 /100 | #13 | Exceptional 5.3% |
| Immigrants | Eastern Asia | 100.0 /100 | #14 | Exceptional 5.3% |
| Immigrants | China | 100.0 /100 | #15 | Exceptional 5.3% |
| Immigrants | Hong Kong | 100.0 /100 | #16 | Exceptional 5.3% |
| Immigrants | Ethiopia | 100.0 /100 | #17 | Exceptional 5.4% |
| Immigrants | Sri Lanka | 100.0 /100 | #18 | Exceptional 5.4% |