Native/Alaskan vs Immigrants from Korea 1 or more Vehicles in Household
COMPARE
Native/Alaskan
Immigrants from Korea
1 or more Vehicles in Household
1 or more Vehicles in Household Comparison
Natives/Alaskans
Immigrants from Korea
89.8%
1 OR MORE VEHICLES IN HOUSEHOLD
59.5/ 100
METRIC RATING
169th/ 347
METRIC RANK
90.5%
1 OR MORE VEHICLES IN HOUSEHOLD
90.5/ 100
METRIC RATING
125th/ 347
METRIC RANK
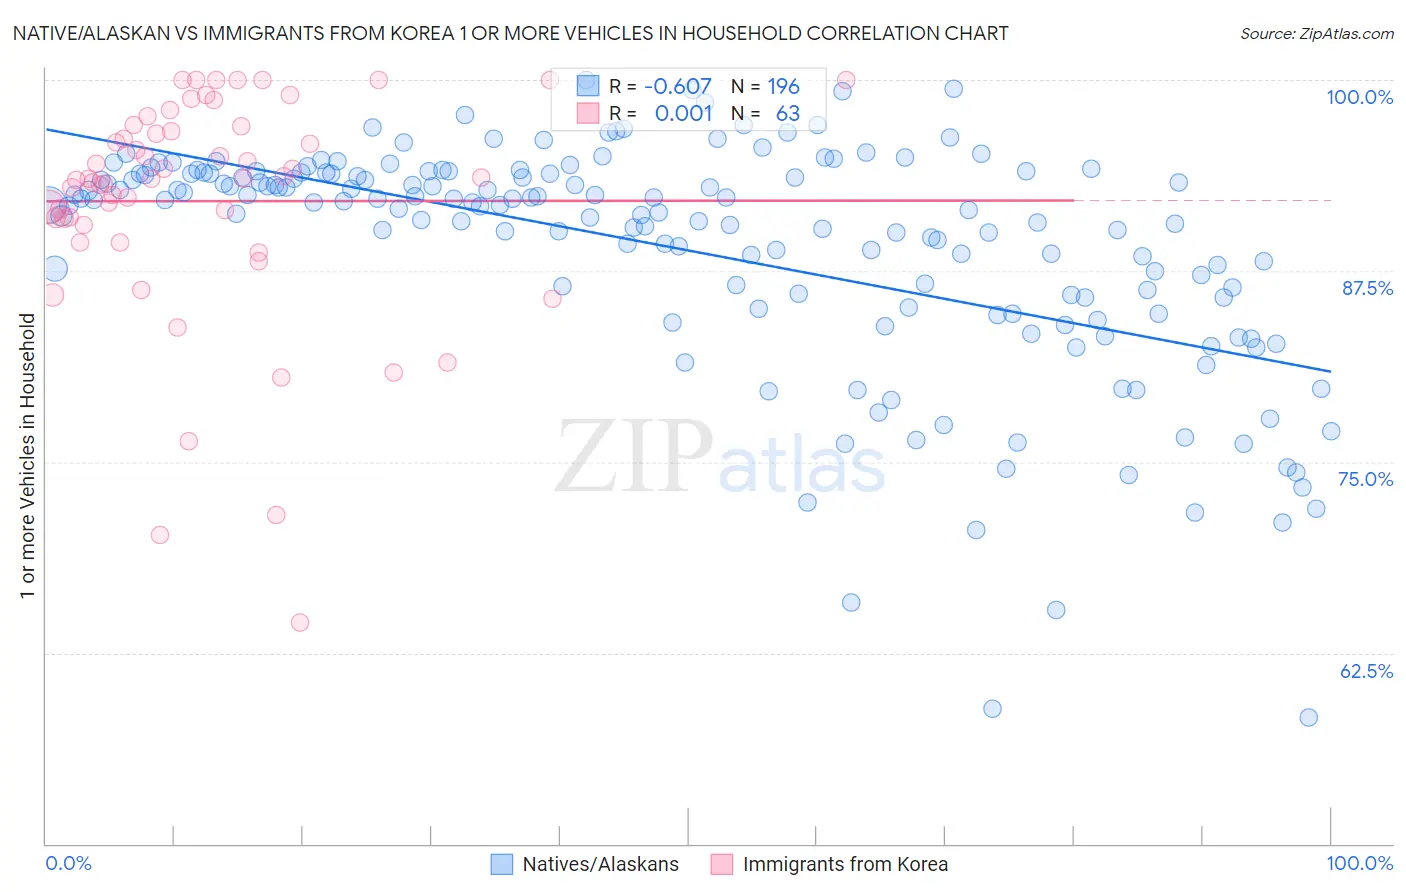
Native/Alaskan vs Immigrants from Korea 1 or more Vehicles in Household Correlation Chart
The statistical analysis conducted on geographies consisting of 512,700,478 people shows a significant negative correlation between the proportion of Natives/Alaskans and percentage of households with 1 or more vehicles available in the United States with a correlation coefficient (R) of -0.607 and weighted average of 89.8%. Similarly, the statistical analysis conducted on geographies consisting of 416,017,081 people shows no correlation between the proportion of Immigrants from Korea and percentage of households with 1 or more vehicles available in the United States with a correlation coefficient (R) of 0.001 and weighted average of 90.5%, a difference of 0.73%.
1 or more Vehicles in Household Correlation Summary
| Measurement | Native/Alaskan | Immigrants from Korea |
| Minimum | 58.3% | 64.5% |
| Maximum | 100.0% | 100.0% |
| Range | 41.7% | 35.5% |
| Mean | 88.9% | 92.1% |
| Median | 91.8% | 93.6% |
| Interquartile 25% (IQ1) | 85.8% | 90.5% |
| Interquartile 75% (IQ3) | 93.9% | 97.0% |
| Interquartile Range (IQR) | 8.1% | 6.5% |
| Standard Deviation (Sample) | 7.6% | 7.5% |
| Standard Deviation (Population) | 7.6% | 7.4% |
Similar Demographics by 1 or more Vehicles in Household
Demographics Similar to Natives/Alaskans by 1 or more Vehicles in Household
In terms of 1 or more vehicles in household, the demographic groups most similar to Natives/Alaskans are Immigrants from Latin America (89.8%, a difference of 0.010%), Immigrants from Cambodia (89.8%, a difference of 0.010%), Immigrants from Costa Rica (89.8%, a difference of 0.030%), Immigrants from Middle Africa (89.9%, a difference of 0.040%), and Immigrants from Saudi Arabia (89.9%, a difference of 0.050%).
| Demographics | Rating | Rank | 1 or more Vehicles in Household |
| Spanish American Indians | 67.0 /100 | #162 | Good 89.9% |
| Immigrants | Austria | 65.5 /100 | #163 | Good 89.9% |
| Comanche | 63.4 /100 | #164 | Good 89.9% |
| Immigrants | Saudi Arabia | 62.6 /100 | #165 | Good 89.9% |
| Immigrants | Middle Africa | 62.2 /100 | #166 | Good 89.9% |
| Immigrants | Latin America | 60.3 /100 | #167 | Good 89.8% |
| Immigrants | Cambodia | 60.1 /100 | #168 | Good 89.8% |
| Natives/Alaskans | 59.5 /100 | #169 | Average 89.8% |
| Immigrants | Costa Rica | 57.6 /100 | #170 | Average 89.8% |
| French American Indians | 54.4 /100 | #171 | Average 89.8% |
| Indonesians | 53.0 /100 | #172 | Average 89.7% |
| Lumbee | 52.8 /100 | #173 | Average 89.7% |
| Filipinos | 50.0 /100 | #174 | Average 89.7% |
| Immigrants | Burma/Myanmar | 47.6 /100 | #175 | Average 89.7% |
| Immigrants | Sudan | 47.1 /100 | #176 | Average 89.7% |
Demographics Similar to Immigrants from Korea by 1 or more Vehicles in Household
In terms of 1 or more vehicles in household, the demographic groups most similar to Immigrants from Korea are Puget Sound Salish (90.5%, a difference of 0.040%), Immigrants from Cameroon (90.4%, a difference of 0.050%), Fijian (90.5%, a difference of 0.060%), Immigrants from the Azores (90.4%, a difference of 0.060%), and Burmese (90.4%, a difference of 0.060%).
| Demographics | Rating | Rank | 1 or more Vehicles in Household |
| Japanese | 93.4 /100 | #118 | Exceptional 90.6% |
| Blackfeet | 92.6 /100 | #119 | Exceptional 90.6% |
| Immigrants | Thailand | 92.3 /100 | #120 | Exceptional 90.6% |
| Icelanders | 92.1 /100 | #121 | Exceptional 90.5% |
| Costa Ricans | 92.0 /100 | #122 | Exceptional 90.5% |
| Fijians | 91.8 /100 | #123 | Exceptional 90.5% |
| Puget Sound Salish | 91.5 /100 | #124 | Exceptional 90.5% |
| Immigrants | Korea | 90.5 /100 | #125 | Exceptional 90.5% |
| Immigrants | Cameroon | 89.4 /100 | #126 | Excellent 90.4% |
| Immigrants | Azores | 89.1 /100 | #127 | Excellent 90.4% |
| Burmese | 89.0 /100 | #128 | Excellent 90.4% |
| Marshallese | 88.9 /100 | #129 | Excellent 90.4% |
| Nicaraguans | 88.8 /100 | #130 | Excellent 90.4% |
| Immigrants | Kenya | 88.5 /100 | #131 | Excellent 90.4% |
| Immigrants | South Africa | 88.1 /100 | #132 | Excellent 90.4% |