Palestinian vs Filipino 4 or more Vehicles in Household
COMPARE
Palestinian
Filipino
4 or more Vehicles in Household
4 or more Vehicles in Household Comparison
Palestinians
Filipinos
6.4%
4 OR MORE VEHICLES IN HOUSEHOLD
65.8/ 100
METRIC RATING
160th/ 347
METRIC RANK
6.9%
4 OR MORE VEHICLES IN HOUSEHOLD
97.6/ 100
METRIC RATING
109th/ 347
METRIC RANK
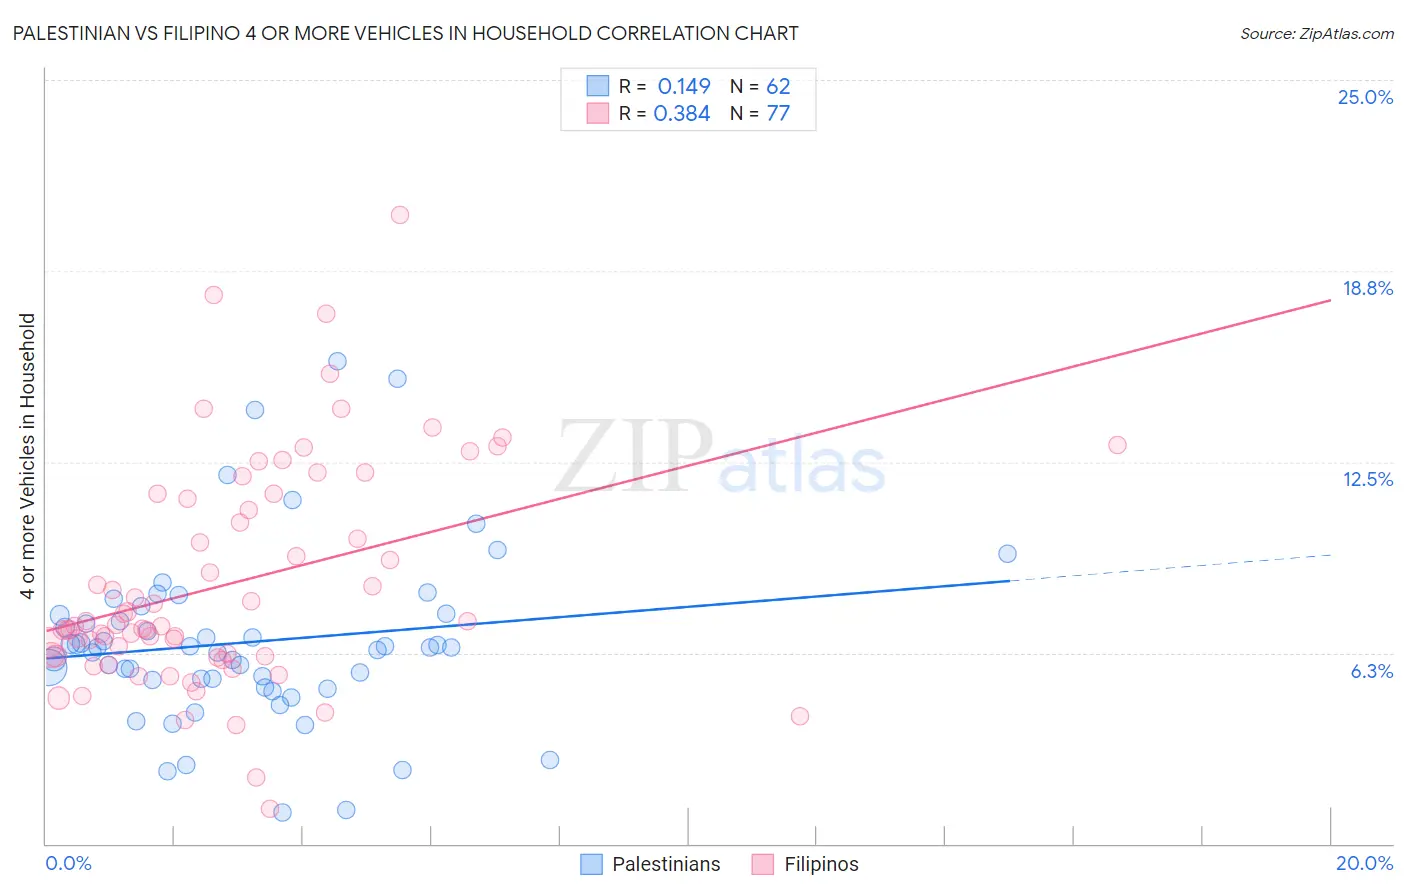
Palestinian vs Filipino 4 or more Vehicles in Household Correlation Chart
The statistical analysis conducted on geographies consisting of 215,710,656 people shows a poor positive correlation between the proportion of Palestinians and percentage of households with 4 or more vehicles available in the United States with a correlation coefficient (R) of 0.149 and weighted average of 6.4%. Similarly, the statistical analysis conducted on geographies consisting of 252,798,218 people shows a mild positive correlation between the proportion of Filipinos and percentage of households with 4 or more vehicles available in the United States with a correlation coefficient (R) of 0.384 and weighted average of 6.9%, a difference of 7.6%.
4 or more Vehicles in Household Correlation Summary
| Measurement | Palestinian | Filipino |
| Minimum | 1.0% | 1.2% |
| Maximum | 15.8% | 20.6% |
| Range | 14.8% | 19.4% |
| Mean | 6.6% | 8.5% |
| Median | 6.4% | 7.1% |
| Interquartile 25% (IQ1) | 5.4% | 6.1% |
| Interquartile 75% (IQ3) | 7.5% | 11.4% |
| Interquartile Range (IQR) | 2.1% | 5.2% |
| Standard Deviation (Sample) | 2.9% | 3.7% |
| Standard Deviation (Population) | 2.8% | 3.7% |
Similar Demographics by 4 or more Vehicles in Household
Demographics Similar to Palestinians by 4 or more Vehicles in Household
In terms of 4 or more vehicles in household, the demographic groups most similar to Palestinians are Indian (Asian) (6.4%, a difference of 0.050%), Zimbabwean (6.4%, a difference of 0.15%), Immigrants from Cameroon (6.4%, a difference of 0.15%), Immigrants from Pakistan (6.4%, a difference of 0.28%), and Peruvian (6.5%, a difference of 0.41%).
| Demographics | Rating | Rank | 4 or more Vehicles in Household |
| Immigrants | Armenia | 71.2 /100 | #153 | Good 6.5% |
| Central American Indians | 71.1 /100 | #154 | Good 6.5% |
| Iroquois | 70.4 /100 | #155 | Good 6.5% |
| Iranians | 69.9 /100 | #156 | Good 6.5% |
| Peruvians | 69.4 /100 | #157 | Good 6.5% |
| Zimbabweans | 67.1 /100 | #158 | Good 6.4% |
| Indians (Asian) | 66.3 /100 | #159 | Good 6.4% |
| Palestinians | 65.8 /100 | #160 | Good 6.4% |
| Immigrants | Cameroon | 64.4 /100 | #161 | Good 6.4% |
| Immigrants | Pakistan | 63.2 /100 | #162 | Good 6.4% |
| Chileans | 61.2 /100 | #163 | Good 6.4% |
| Hungarians | 61.1 /100 | #164 | Good 6.4% |
| Immigrants | Peru | 59.8 /100 | #165 | Average 6.4% |
| Immigrants | Denmark | 57.8 /100 | #166 | Average 6.4% |
| Poles | 56.9 /100 | #167 | Average 6.4% |
Demographics Similar to Filipinos by 4 or more Vehicles in Household
In terms of 4 or more vehicles in household, the demographic groups most similar to Filipinos are French (6.9%, a difference of 0.18%), Immigrants from Thailand (6.9%, a difference of 0.50%), Nicaraguan (7.0%, a difference of 0.52%), Guatemalan (7.0%, a difference of 0.53%), and Aleut (6.9%, a difference of 0.53%).
| Demographics | Rating | Rank | 4 or more Vehicles in Household |
| Asians | 98.6 /100 | #102 | Exceptional 7.0% |
| Blackfeet | 98.6 /100 | #103 | Exceptional 7.0% |
| Hmong | 98.3 /100 | #104 | Exceptional 7.0% |
| German Russians | 98.3 /100 | #105 | Exceptional 7.0% |
| Guatemalans | 98.1 /100 | #106 | Exceptional 7.0% |
| Nicaraguans | 98.0 /100 | #107 | Exceptional 7.0% |
| French | 97.7 /100 | #108 | Exceptional 6.9% |
| Filipinos | 97.6 /100 | #109 | Exceptional 6.9% |
| Immigrants | Thailand | 97.0 /100 | #110 | Exceptional 6.9% |
| Aleuts | 97.0 /100 | #111 | Exceptional 6.9% |
| Hopi | 97.0 /100 | #112 | Exceptional 6.9% |
| Canadians | 96.4 /100 | #113 | Exceptional 6.9% |
| Bolivians | 96.3 /100 | #114 | Exceptional 6.8% |
| Tlingit-Haida | 96.2 /100 | #115 | Exceptional 6.8% |
| Immigrants | Guatemala | 95.8 /100 | #116 | Exceptional 6.8% |