Palestinian vs Filipino Doctorate Degree
COMPARE
Palestinian
Filipino
Doctorate Degree
Doctorate Degree Comparison
Palestinians
Filipinos
2.0%
DOCTORATE DEGREE
92.0/ 100
METRIC RATING
127th/ 347
METRIC RANK
3.4%
DOCTORATE DEGREE
100.0/ 100
METRIC RATING
2nd/ 347
METRIC RANK
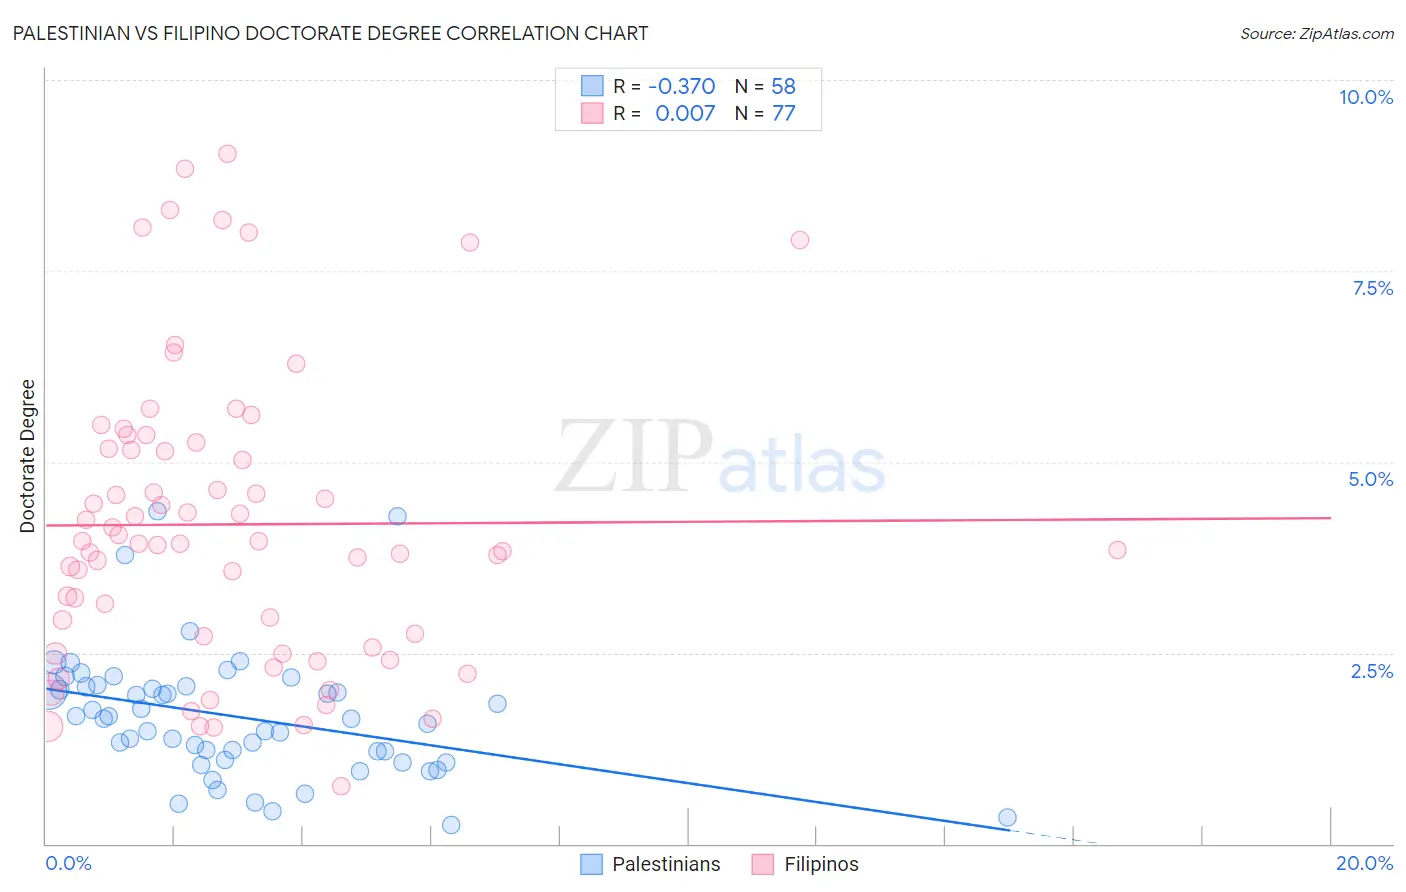
Palestinian vs Filipino Doctorate Degree Correlation Chart
The statistical analysis conducted on geographies consisting of 215,891,149 people shows a mild negative correlation between the proportion of Palestinians and percentage of population with at least doctorate degree education in the United States with a correlation coefficient (R) of -0.370 and weighted average of 2.0%. Similarly, the statistical analysis conducted on geographies consisting of 253,646,775 people shows no correlation between the proportion of Filipinos and percentage of population with at least doctorate degree education in the United States with a correlation coefficient (R) of 0.007 and weighted average of 3.4%, a difference of 71.4%.
Doctorate Degree Correlation Summary
| Measurement | Palestinian | Filipino |
| Minimum | 0.24% | 0.76% |
| Maximum | 4.4% | 9.0% |
| Range | 4.1% | 8.3% |
| Mean | 1.7% | 4.2% |
| Median | 1.6% | 3.9% |
| Interquartile 25% (IQ1) | 1.1% | 2.6% |
| Interquartile 75% (IQ3) | 2.1% | 5.2% |
| Interquartile Range (IQR) | 0.95% | 2.6% |
| Standard Deviation (Sample) | 0.83% | 1.9% |
| Standard Deviation (Population) | 0.82% | 1.9% |
Similar Demographics by Doctorate Degree
Demographics Similar to Palestinians by Doctorate Degree
In terms of doctorate degree, the demographic groups most similar to Palestinians are Jordanian (2.0%, a difference of 0.040%), Immigrants from Zaire (2.0%, a difference of 0.42%), Moroccan (2.0%, a difference of 0.45%), Ute (2.0%, a difference of 0.56%), and Canadian (2.0%, a difference of 0.63%).
| Demographics | Rating | Rank | Doctorate Degree |
| Immigrants | Morocco | 95.5 /100 | #120 | Exceptional 2.0% |
| Immigrants | Jordan | 94.8 /100 | #121 | Exceptional 2.0% |
| Immigrants | Southern Europe | 94.7 /100 | #122 | Exceptional 2.0% |
| Croatians | 94.0 /100 | #123 | Exceptional 2.0% |
| Ute | 93.2 /100 | #124 | Exceptional 2.0% |
| Moroccans | 93.0 /100 | #125 | Exceptional 2.0% |
| Jordanians | 92.1 /100 | #126 | Exceptional 2.0% |
| Palestinians | 92.0 /100 | #127 | Exceptional 2.0% |
| Immigrants | Zaire | 91.1 /100 | #128 | Exceptional 2.0% |
| Canadians | 90.6 /100 | #129 | Exceptional 2.0% |
| Immigrants | Ukraine | 90.5 /100 | #130 | Exceptional 2.0% |
| Immigrants | Sierra Leone | 90.2 /100 | #131 | Exceptional 2.0% |
| Scottish | 89.4 /100 | #132 | Excellent 2.0% |
| Immigrants | Uzbekistan | 89.3 /100 | #133 | Excellent 2.0% |
| Immigrants | Cameroon | 88.9 /100 | #134 | Excellent 2.0% |
Demographics Similar to Filipinos by Doctorate Degree
In terms of doctorate degree, the demographic groups most similar to Filipinos are Okinawan (3.3%, a difference of 4.7%), Immigrants from Singapore (3.7%, a difference of 7.2%), Immigrants from Taiwan (3.2%, a difference of 7.4%), Iranian (3.1%, a difference of 9.1%), and Immigrants from Switzerland (3.1%, a difference of 11.2%).
| Demographics | Rating | Rank | Doctorate Degree |
| Immigrants | Singapore | 100.0 /100 | #1 | Exceptional 3.7% |
| Filipinos | 100.0 /100 | #2 | Exceptional 3.4% |
| Okinawans | 100.0 /100 | #3 | Exceptional 3.3% |
| Immigrants | Taiwan | 100.0 /100 | #4 | Exceptional 3.2% |
| Iranians | 100.0 /100 | #5 | Exceptional 3.1% |
| Immigrants | Switzerland | 100.0 /100 | #6 | Exceptional 3.1% |
| Immigrants | China | 100.0 /100 | #7 | Exceptional 3.1% |
| Immigrants | Israel | 100.0 /100 | #8 | Exceptional 3.0% |
| Immigrants | Iran | 100.0 /100 | #9 | Exceptional 3.0% |
| Immigrants | Eastern Asia | 100.0 /100 | #10 | Exceptional 3.0% |
| Indians (Asian) | 100.0 /100 | #11 | Exceptional 2.9% |
| Immigrants | Belgium | 100.0 /100 | #12 | Exceptional 2.9% |
| Immigrants | Sweden | 100.0 /100 | #13 | Exceptional 2.9% |
| Immigrants | France | 100.0 /100 | #14 | Exceptional 2.9% |
| Immigrants | India | 100.0 /100 | #15 | Exceptional 2.8% |