Palestinian vs Immigrants from Lebanon 4 or more Vehicles in Household
COMPARE
Palestinian
Immigrants from Lebanon
4 or more Vehicles in Household
4 or more Vehicles in Household Comparison
Palestinians
Immigrants from Lebanon
6.4%
4 OR MORE VEHICLES IN HOUSEHOLD
65.8/ 100
METRIC RATING
160th/ 347
METRIC RANK
6.3%
4 OR MORE VEHICLES IN HOUSEHOLD
51.7/ 100
METRIC RATING
172nd/ 347
METRIC RANK
Palestinian vs Immigrants from Lebanon 4 or more Vehicles in Household Correlation Chart
The statistical analysis conducted on geographies consisting of 215,710,656 people shows a poor positive correlation between the proportion of Palestinians and percentage of households with 4 or more vehicles available in the United States with a correlation coefficient (R) of 0.149 and weighted average of 6.4%. Similarly, the statistical analysis conducted on geographies consisting of 216,708,139 people shows a strong positive correlation between the proportion of Immigrants from Lebanon and percentage of households with 4 or more vehicles available in the United States with a correlation coefficient (R) of 0.702 and weighted average of 6.3%, a difference of 1.5%.
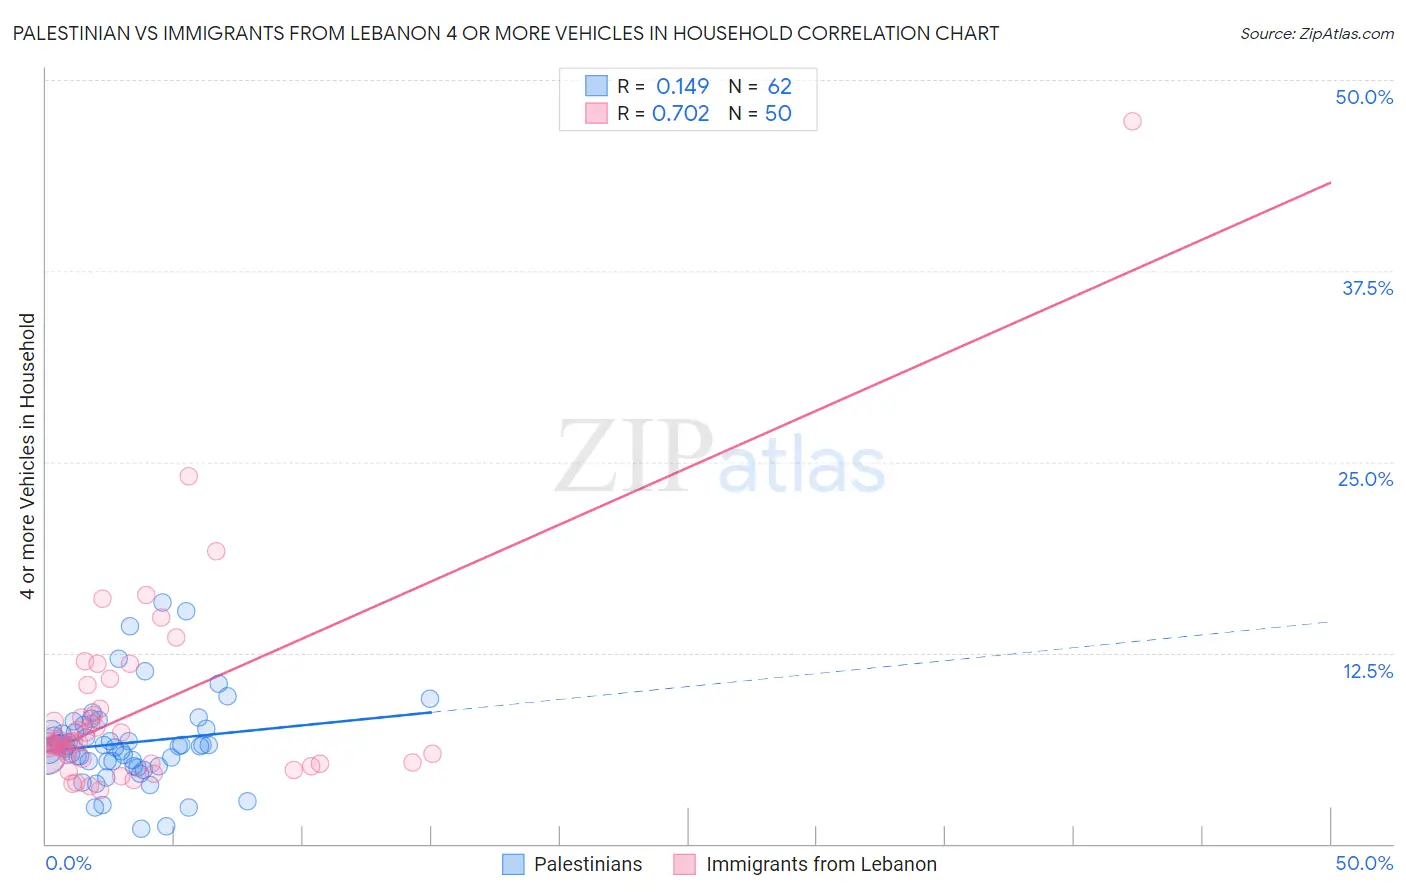
4 or more Vehicles in Household Correlation Summary
| Measurement | Palestinian | Immigrants from Lebanon |
| Minimum | 1.0% | 3.5% |
| Maximum | 15.8% | 47.3% |
| Range | 14.8% | 43.7% |
| Mean | 6.6% | 8.8% |
| Median | 6.4% | 6.6% |
| Interquartile 25% (IQ1) | 5.4% | 5.3% |
| Interquartile 75% (IQ3) | 7.5% | 8.8% |
| Interquartile Range (IQR) | 2.1% | 3.6% |
| Standard Deviation (Sample) | 2.9% | 7.0% |
| Standard Deviation (Population) | 2.8% | 6.9% |
Demographics Similar to Palestinians and Immigrants from Lebanon by 4 or more Vehicles in Household
In terms of 4 or more vehicles in household, the demographic groups most similar to Palestinians are Indian (Asian) (6.4%, a difference of 0.050%), Zimbabwean (6.4%, a difference of 0.15%), Immigrants from Cameroon (6.4%, a difference of 0.15%), Immigrants from Pakistan (6.4%, a difference of 0.28%), and Peruvian (6.5%, a difference of 0.41%). Similarly, the demographic groups most similar to Immigrants from Lebanon are Immigrants from India (6.3%, a difference of 0.020%), Slovene (6.3%, a difference of 0.060%), Immigrants from Syria (6.3%, a difference of 0.11%), Lithuanian (6.3%, a difference of 0.17%), and Immigrants from Western Europe (6.3%, a difference of 0.29%).
| Demographics | Rating | Rank | 4 or more Vehicles in Household |
| Iranians | 69.9 /100 | #156 | Good 6.5% |
| Peruvians | 69.4 /100 | #157 | Good 6.5% |
| Zimbabweans | 67.1 /100 | #158 | Good 6.4% |
| Indians (Asian) | 66.3 /100 | #159 | Good 6.4% |
| Palestinians | 65.8 /100 | #160 | Good 6.4% |
| Immigrants | Cameroon | 64.4 /100 | #161 | Good 6.4% |
| Immigrants | Pakistan | 63.2 /100 | #162 | Good 6.4% |
| Chileans | 61.2 /100 | #163 | Good 6.4% |
| Hungarians | 61.1 /100 | #164 | Good 6.4% |
| Immigrants | Peru | 59.8 /100 | #165 | Average 6.4% |
| Immigrants | Denmark | 57.8 /100 | #166 | Average 6.4% |
| Poles | 56.9 /100 | #167 | Average 6.4% |
| Lebanese | 55.8 /100 | #168 | Average 6.4% |
| Estonians | 55.1 /100 | #169 | Average 6.4% |
| Immigrants | Syria | 52.8 /100 | #170 | Average 6.3% |
| Immigrants | India | 51.9 /100 | #171 | Average 6.3% |
| Immigrants | Lebanon | 51.7 /100 | #172 | Average 6.3% |
| Slovenes | 51.1 /100 | #173 | Average 6.3% |
| Lithuanians | 50.0 /100 | #174 | Average 6.3% |
| Immigrants | Western Europe | 48.8 /100 | #175 | Average 6.3% |
| Ukrainians | 47.6 /100 | #176 | Average 6.3% |