Italian vs Filipino 4 or more Vehicles in Household
COMPARE
Italian
Filipino
4 or more Vehicles in Household
4 or more Vehicles in Household Comparison
Italians
Filipinos
6.6%
4 OR MORE VEHICLES IN HOUSEHOLD
84.5/ 100
METRIC RATING
138th/ 347
METRIC RANK
6.9%
4 OR MORE VEHICLES IN HOUSEHOLD
97.6/ 100
METRIC RATING
109th/ 347
METRIC RANK
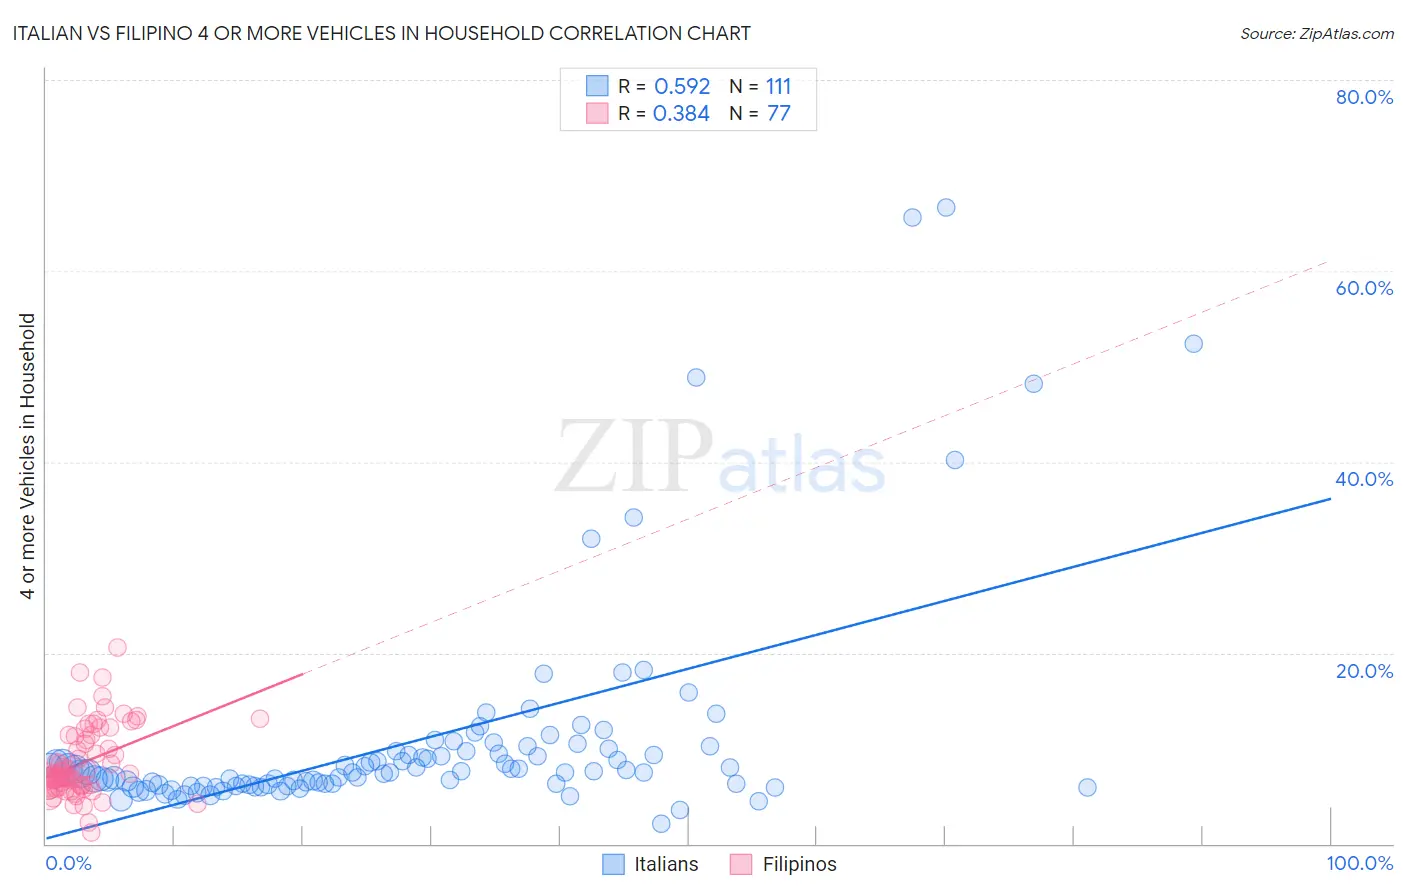
Italian vs Filipino 4 or more Vehicles in Household Correlation Chart
The statistical analysis conducted on geographies consisting of 571,215,304 people shows a substantial positive correlation between the proportion of Italians and percentage of households with 4 or more vehicles available in the United States with a correlation coefficient (R) of 0.592 and weighted average of 6.6%. Similarly, the statistical analysis conducted on geographies consisting of 252,798,218 people shows a mild positive correlation between the proportion of Filipinos and percentage of households with 4 or more vehicles available in the United States with a correlation coefficient (R) of 0.384 and weighted average of 6.9%, a difference of 4.8%.
4 or more Vehicles in Household Correlation Summary
| Measurement | Italian | Filipino |
| Minimum | 2.1% | 1.2% |
| Maximum | 66.7% | 20.6% |
| Range | 64.5% | 19.4% |
| Mean | 10.9% | 8.5% |
| Median | 7.5% | 7.1% |
| Interquartile 25% (IQ1) | 6.1% | 6.1% |
| Interquartile 75% (IQ3) | 9.7% | 11.4% |
| Interquartile Range (IQR) | 3.6% | 5.2% |
| Standard Deviation (Sample) | 11.4% | 3.7% |
| Standard Deviation (Population) | 11.3% | 3.7% |
Similar Demographics by 4 or more Vehicles in Household
Demographics Similar to Italians by 4 or more Vehicles in Household
In terms of 4 or more vehicles in household, the demographic groups most similar to Italians are French Canadian (6.6%, a difference of 0.16%), Luxembourger (6.6%, a difference of 0.36%), Tohono O'odham (6.6%, a difference of 0.43%), Jordanian (6.6%, a difference of 0.43%), and Ottawa (6.6%, a difference of 0.46%).
| Demographics | Rating | Rank | 4 or more Vehicles in Household |
| Maltese | 88.4 /100 | #131 | Excellent 6.7% |
| Immigrants | Netherlands | 87.8 /100 | #132 | Excellent 6.6% |
| Armenians | 86.9 /100 | #133 | Excellent 6.6% |
| Ottawa | 86.9 /100 | #134 | Excellent 6.6% |
| Tohono O'odham | 86.7 /100 | #135 | Excellent 6.6% |
| Luxembourgers | 86.4 /100 | #136 | Excellent 6.6% |
| French Canadians | 85.4 /100 | #137 | Excellent 6.6% |
| Italians | 84.5 /100 | #138 | Excellent 6.6% |
| Jordanians | 82.1 /100 | #139 | Excellent 6.6% |
| Slavs | 81.6 /100 | #140 | Excellent 6.6% |
| Australians | 80.8 /100 | #141 | Excellent 6.6% |
| Immigrants | Iraq | 79.4 /100 | #142 | Good 6.5% |
| Immigrants | Canada | 78.6 /100 | #143 | Good 6.5% |
| Immigrants | North America | 78.5 /100 | #144 | Good 6.5% |
| Croatians | 77.8 /100 | #145 | Good 6.5% |
Demographics Similar to Filipinos by 4 or more Vehicles in Household
In terms of 4 or more vehicles in household, the demographic groups most similar to Filipinos are French (6.9%, a difference of 0.18%), Immigrants from Thailand (6.9%, a difference of 0.50%), Nicaraguan (7.0%, a difference of 0.52%), Guatemalan (7.0%, a difference of 0.53%), and Aleut (6.9%, a difference of 0.53%).
| Demographics | Rating | Rank | 4 or more Vehicles in Household |
| Asians | 98.6 /100 | #102 | Exceptional 7.0% |
| Blackfeet | 98.6 /100 | #103 | Exceptional 7.0% |
| Hmong | 98.3 /100 | #104 | Exceptional 7.0% |
| German Russians | 98.3 /100 | #105 | Exceptional 7.0% |
| Guatemalans | 98.1 /100 | #106 | Exceptional 7.0% |
| Nicaraguans | 98.0 /100 | #107 | Exceptional 7.0% |
| French | 97.7 /100 | #108 | Exceptional 6.9% |
| Filipinos | 97.6 /100 | #109 | Exceptional 6.9% |
| Immigrants | Thailand | 97.0 /100 | #110 | Exceptional 6.9% |
| Aleuts | 97.0 /100 | #111 | Exceptional 6.9% |
| Hopi | 97.0 /100 | #112 | Exceptional 6.9% |
| Canadians | 96.4 /100 | #113 | Exceptional 6.9% |
| Bolivians | 96.3 /100 | #114 | Exceptional 6.8% |
| Tlingit-Haida | 96.2 /100 | #115 | Exceptional 6.8% |
| Immigrants | Guatemala | 95.8 /100 | #116 | Exceptional 6.8% |