Immigrants from Ecuador vs French American Indian 2 or more Vehicles in Household
COMPARE
Immigrants from Ecuador
French American Indian
2 or more Vehicles in Household
2 or more Vehicles in Household Comparison
Immigrants from Ecuador
French American Indians
40.5%
2 OR MORE VEHICLES IN HOUSEHOLD
0.0/ 100
METRIC RATING
333rd/ 347
METRIC RANK
55.5%
2 OR MORE VEHICLES IN HOUSEHOLD
56.7/ 100
METRIC RATING
168th/ 347
METRIC RANK
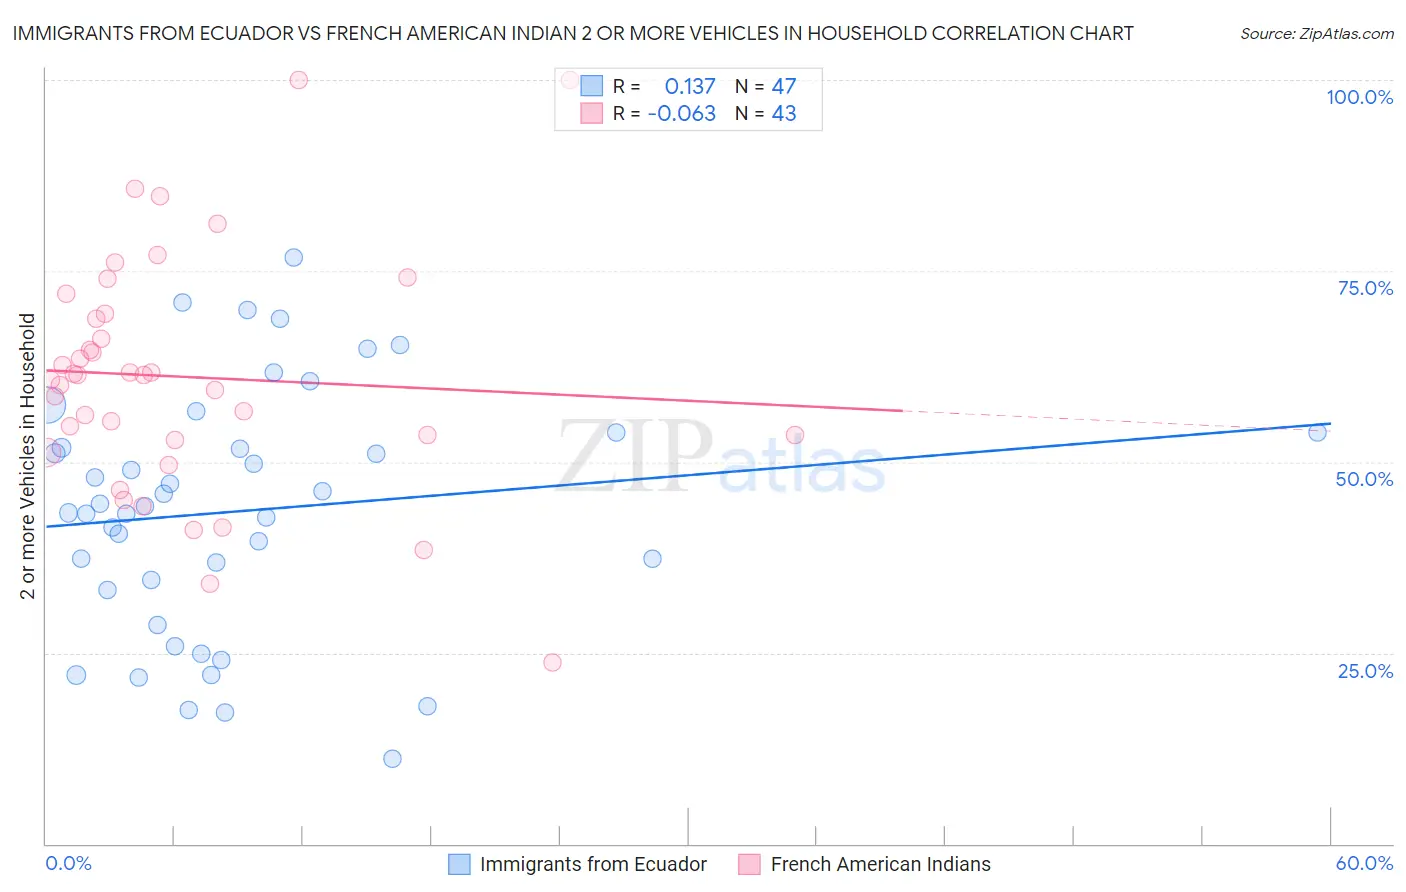
Immigrants from Ecuador vs French American Indian 2 or more Vehicles in Household Correlation Chart
The statistical analysis conducted on geographies consisting of 270,900,230 people shows a poor positive correlation between the proportion of Immigrants from Ecuador and percentage of households with 2 or more vehicles available in the United States with a correlation coefficient (R) of 0.137 and weighted average of 40.5%. Similarly, the statistical analysis conducted on geographies consisting of 131,972,181 people shows a slight negative correlation between the proportion of French American Indians and percentage of households with 2 or more vehicles available in the United States with a correlation coefficient (R) of -0.063 and weighted average of 55.5%, a difference of 37.0%.
2 or more Vehicles in Household Correlation Summary
| Measurement | Immigrants from Ecuador | French American Indian |
| Minimum | 11.1% | 23.7% |
| Maximum | 76.8% | 100.0% |
| Range | 65.7% | 76.2% |
| Mean | 43.6% | 61.1% |
| Median | 44.2% | 61.3% |
| Interquartile 25% (IQ1) | 33.2% | 52.9% |
| Interquartile 75% (IQ3) | 53.8% | 69.4% |
| Interquartile Range (IQR) | 20.6% | 16.5% |
| Standard Deviation (Sample) | 16.0% | 15.8% |
| Standard Deviation (Population) | 15.8% | 15.6% |
Similar Demographics by 2 or more Vehicles in Household
Demographics Similar to Immigrants from Ecuador by 2 or more Vehicles in Household
In terms of 2 or more vehicles in household, the demographic groups most similar to Immigrants from Ecuador are Immigrants from Trinidad and Tobago (40.3%, a difference of 0.58%), Trinidadian and Tobagonian (40.9%, a difference of 0.92%), West Indian (41.3%, a difference of 1.9%), Immigrants from Dominica (41.6%, a difference of 2.8%), and Ecuadorian (42.0%, a difference of 3.6%).
| Demographics | Rating | Rank | 2 or more Vehicles in Household |
| Immigrants | Senegal | 0.0 /100 | #326 | Tragic 43.0% |
| Immigrants | Yemen | 0.0 /100 | #327 | Tragic 42.8% |
| Inupiat | 0.0 /100 | #328 | Tragic 42.6% |
| Ecuadorians | 0.0 /100 | #329 | Tragic 42.0% |
| Immigrants | Dominica | 0.0 /100 | #330 | Tragic 41.6% |
| West Indians | 0.0 /100 | #331 | Tragic 41.3% |
| Trinidadians and Tobagonians | 0.0 /100 | #332 | Tragic 40.9% |
| Immigrants | Ecuador | 0.0 /100 | #333 | Tragic 40.5% |
| Immigrants | Trinidad and Tobago | 0.0 /100 | #334 | Tragic 40.3% |
| Immigrants | Bangladesh | 0.0 /100 | #335 | Tragic 38.8% |
| Vietnamese | 0.0 /100 | #336 | Tragic 38.5% |
| Barbadians | 0.0 /100 | #337 | Tragic 38.3% |
| Immigrants | Uzbekistan | 0.0 /100 | #338 | Tragic 37.9% |
| Immigrants | Barbados | 0.0 /100 | #339 | Tragic 35.8% |
| British West Indians | 0.0 /100 | #340 | Tragic 35.4% |
Demographics Similar to French American Indians by 2 or more Vehicles in Household
In terms of 2 or more vehicles in household, the demographic groups most similar to French American Indians are Immigrants from Austria (55.5%, a difference of 0.010%), Romanian (55.5%, a difference of 0.030%), Kenyan (55.5%, a difference of 0.060%), Immigrants from Sri Lanka (55.5%, a difference of 0.070%), and Immigrants from Costa Rica (55.4%, a difference of 0.090%).
| Demographics | Rating | Rank | 2 or more Vehicles in Household |
| Colville | 61.1 /100 | #161 | Good 55.6% |
| German Russians | 60.9 /100 | #162 | Good 55.6% |
| Immigrants | Zimbabwe | 60.2 /100 | #163 | Good 55.6% |
| Dutch West Indians | 59.8 /100 | #164 | Average 55.6% |
| Immigrants | El Salvador | 59.4 /100 | #165 | Average 55.6% |
| Immigrants | Sri Lanka | 58.3 /100 | #166 | Average 55.5% |
| Kenyans | 58.1 /100 | #167 | Average 55.5% |
| French American Indians | 56.7 /100 | #168 | Average 55.5% |
| Immigrants | Austria | 56.3 /100 | #169 | Average 55.5% |
| Romanians | 55.8 /100 | #170 | Average 55.5% |
| Immigrants | Costa Rica | 54.4 /100 | #171 | Average 55.4% |
| Immigrants | Nicaragua | 51.6 /100 | #172 | Average 55.4% |
| Immigrants | Western Europe | 51.4 /100 | #173 | Average 55.4% |
| Navajo | 50.0 /100 | #174 | Average 55.3% |
| Immigrants | Denmark | 49.4 /100 | #175 | Average 55.3% |