Osage vs Chinese 2 or more Vehicles in Household
COMPARE
Osage
Chinese
2 or more Vehicles in Household
2 or more Vehicles in Household Comparison
Osage
Chinese
58.8%
2 OR MORE VEHICLES IN HOUSEHOLD
99.8/ 100
METRIC RATING
61st/ 347
METRIC RANK
60.1%
2 OR MORE VEHICLES IN HOUSEHOLD
100.0/ 100
METRIC RATING
36th/ 347
METRIC RANK
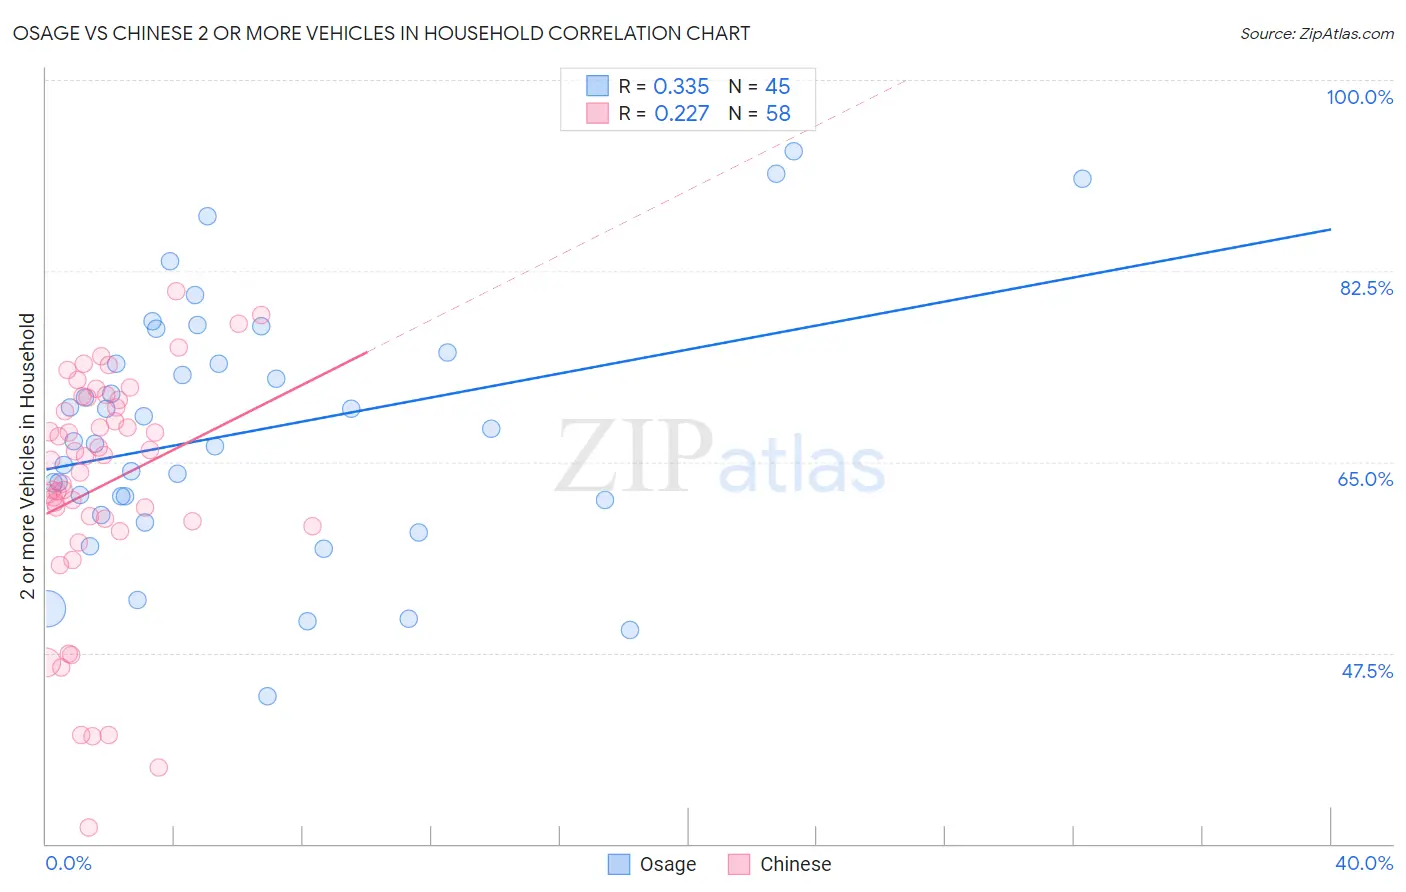
Osage vs Chinese 2 or more Vehicles in Household Correlation Chart
The statistical analysis conducted on geographies consisting of 91,799,602 people shows a mild positive correlation between the proportion of Osage and percentage of households with 2 or more vehicles available in the United States with a correlation coefficient (R) of 0.335 and weighted average of 58.8%. Similarly, the statistical analysis conducted on geographies consisting of 64,802,428 people shows a weak positive correlation between the proportion of Chinese and percentage of households with 2 or more vehicles available in the United States with a correlation coefficient (R) of 0.227 and weighted average of 60.1%, a difference of 2.2%.
2 or more Vehicles in Household Correlation Summary
| Measurement | Osage | Chinese |
| Minimum | 43.5% | 31.5% |
| Maximum | 93.5% | 80.6% |
| Range | 50.0% | 49.2% |
| Mean | 67.8% | 62.8% |
| Median | 66.9% | 65.3% |
| Interquartile 25% (IQ1) | 60.8% | 59.5% |
| Interquartile 75% (IQ3) | 74.5% | 70.6% |
| Interquartile Range (IQR) | 13.7% | 11.1% |
| Standard Deviation (Sample) | 11.5% | 10.9% |
| Standard Deviation (Population) | 11.4% | 10.8% |
Similar Demographics by 2 or more Vehicles in Household
Demographics Similar to Osage by 2 or more Vehicles in Household
In terms of 2 or more vehicles in household, the demographic groups most similar to Osage are Nonimmigrants (58.8%, a difference of 0.040%), Mexican American Indian (58.7%, a difference of 0.11%), French Canadian (58.9%, a difference of 0.13%), Spanish American (58.9%, a difference of 0.16%), and Immigrants from Scotland (58.9%, a difference of 0.18%).
| Demographics | Rating | Rank | 2 or more Vehicles in Household |
| Bhutanese | 99.9 /100 | #54 | Exceptional 59.1% |
| Luxembourgers | 99.9 /100 | #55 | Exceptional 59.1% |
| Chickasaw | 99.9 /100 | #56 | Exceptional 59.0% |
| Afghans | 99.9 /100 | #57 | Exceptional 59.0% |
| Immigrants | Scotland | 99.8 /100 | #58 | Exceptional 58.9% |
| Spanish Americans | 99.8 /100 | #59 | Exceptional 58.9% |
| French Canadians | 99.8 /100 | #60 | Exceptional 58.9% |
| Osage | 99.8 /100 | #61 | Exceptional 58.8% |
| Immigrants | Nonimmigrants | 99.8 /100 | #62 | Exceptional 58.8% |
| Mexican American Indians | 99.8 /100 | #63 | Exceptional 58.7% |
| Portuguese | 99.7 /100 | #64 | Exceptional 58.6% |
| Immigrants | Central America | 99.7 /100 | #65 | Exceptional 58.6% |
| Croatians | 99.7 /100 | #66 | Exceptional 58.6% |
| Laotians | 99.7 /100 | #67 | Exceptional 58.6% |
| Canadians | 99.7 /100 | #68 | Exceptional 58.6% |
Demographics Similar to Chinese by 2 or more Vehicles in Household
In terms of 2 or more vehicles in household, the demographic groups most similar to Chinese are Immigrants from Philippines (60.1%, a difference of 0.020%), Irish (60.1%, a difference of 0.030%), American (60.0%, a difference of 0.10%), British (60.0%, a difference of 0.10%), and Spanish (60.2%, a difference of 0.14%).
| Demographics | Rating | Rank | 2 or more Vehicles in Household |
| Hawaiians | 100.0 /100 | #29 | Exceptional 60.4% |
| Finns | 100.0 /100 | #30 | Exceptional 60.3% |
| Spanish American Indians | 100.0 /100 | #31 | Exceptional 60.3% |
| Arapaho | 100.0 /100 | #32 | Exceptional 60.2% |
| Immigrants | Mexico | 100.0 /100 | #33 | Exceptional 60.2% |
| Spanish | 100.0 /100 | #34 | Exceptional 60.2% |
| Immigrants | Philippines | 100.0 /100 | #35 | Exceptional 60.1% |
| Chinese | 100.0 /100 | #36 | Exceptional 60.1% |
| Irish | 100.0 /100 | #37 | Exceptional 60.1% |
| Americans | 100.0 /100 | #38 | Exceptional 60.0% |
| British | 100.0 /100 | #39 | Exceptional 60.0% |
| Cherokee | 100.0 /100 | #40 | Exceptional 59.9% |
| Northern Europeans | 100.0 /100 | #41 | Exceptional 59.9% |
| Malaysians | 100.0 /100 | #42 | Exceptional 59.8% |
| Czechoslovakians | 100.0 /100 | #43 | Exceptional 59.8% |