Osage vs Immigrants from Venezuela 3 or more Vehicles in Household
COMPARE
Osage
Immigrants from Venezuela
3 or more Vehicles in Household
3 or more Vehicles in Household Comparison
Osage
Immigrants from Venezuela
22.7%
3 OR MORE VEHICLES IN HOUSEHOLD
100.0/ 100
METRIC RATING
43rd/ 347
METRIC RANK
17.7%
3 OR MORE VEHICLES IN HOUSEHOLD
0.8/ 100
METRIC RATING
267th/ 347
METRIC RANK
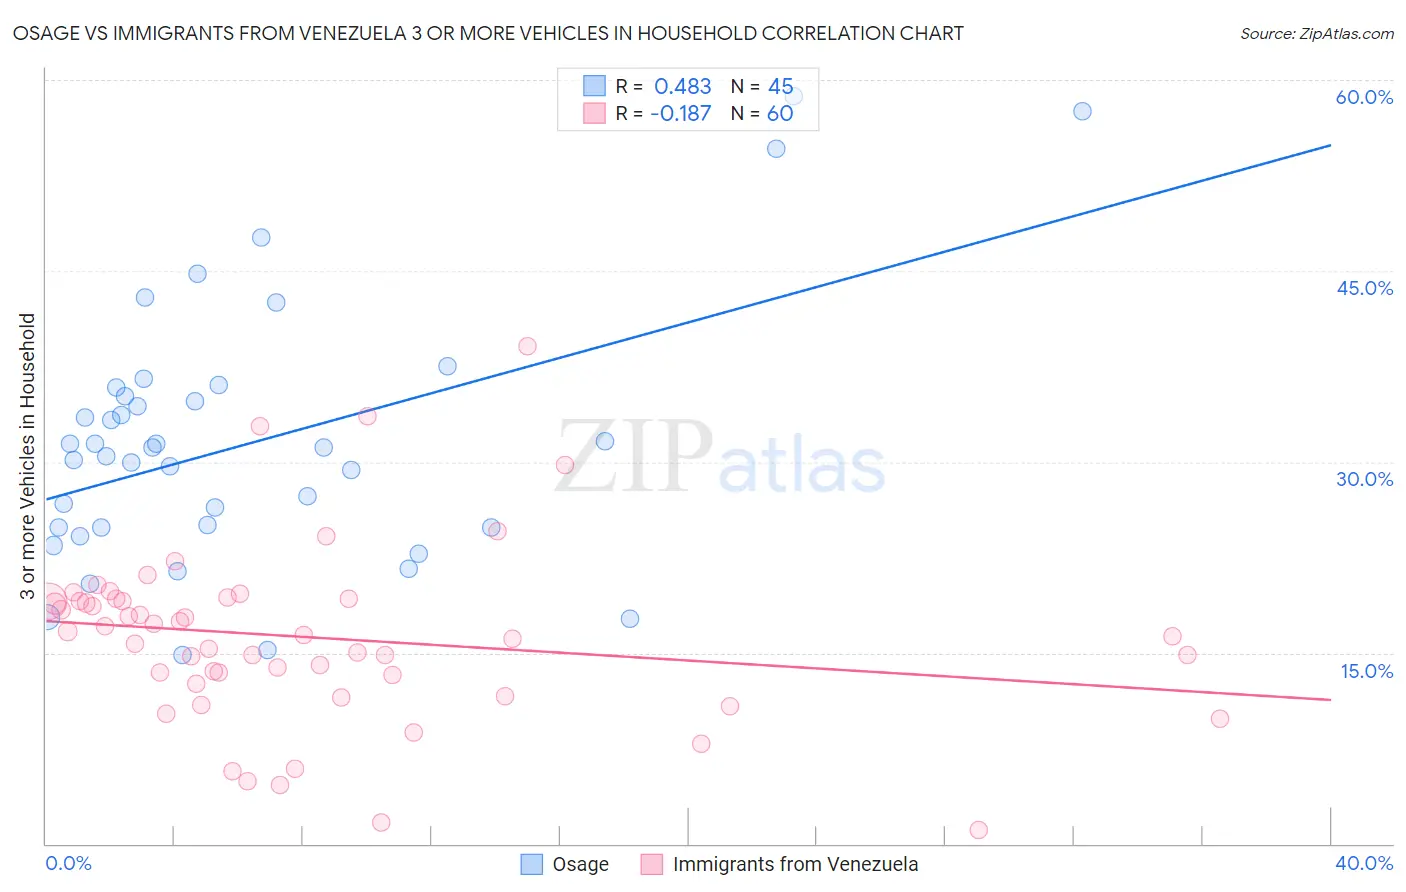
Osage vs Immigrants from Venezuela 3 or more Vehicles in Household Correlation Chart
The statistical analysis conducted on geographies consisting of 91,796,142 people shows a moderate positive correlation between the proportion of Osage and percentage of households with 3 or more vehicles available in the United States with a correlation coefficient (R) of 0.483 and weighted average of 22.7%. Similarly, the statistical analysis conducted on geographies consisting of 287,740,721 people shows a poor negative correlation between the proportion of Immigrants from Venezuela and percentage of households with 3 or more vehicles available in the United States with a correlation coefficient (R) of -0.187 and weighted average of 17.7%, a difference of 28.2%.
3 or more Vehicles in Household Correlation Summary
| Measurement | Osage | Immigrants from Venezuela |
| Minimum | 14.9% | 1.1% |
| Maximum | 58.7% | 39.1% |
| Range | 43.8% | 38.0% |
| Mean | 31.5% | 16.2% |
| Median | 31.1% | 16.3% |
| Interquartile 25% (IQ1) | 24.8% | 12.9% |
| Interquartile 75% (IQ3) | 35.5% | 19.1% |
| Interquartile Range (IQR) | 10.7% | 6.2% |
| Standard Deviation (Sample) | 10.1% | 7.0% |
| Standard Deviation (Population) | 10.0% | 7.0% |
Similar Demographics by 3 or more Vehicles in Household
Demographics Similar to Osage by 3 or more Vehicles in Household
In terms of 3 or more vehicles in household, the demographic groups most similar to Osage are Native/Alaskan (22.7%, a difference of 0.11%), German (22.7%, a difference of 0.12%), Cheyenne (22.7%, a difference of 0.13%), Ute (22.7%, a difference of 0.23%), and American (22.6%, a difference of 0.42%).
| Demographics | Rating | Rank | 3 or more Vehicles in Household |
| Cherokee | 100.0 /100 | #36 | Exceptional 23.0% |
| Swedes | 100.0 /100 | #37 | Exceptional 23.0% |
| Dutch | 100.0 /100 | #38 | Exceptional 22.9% |
| Yaqui | 100.0 /100 | #39 | Exceptional 22.9% |
| Europeans | 100.0 /100 | #40 | Exceptional 22.9% |
| Germans | 100.0 /100 | #41 | Exceptional 22.7% |
| Natives/Alaskans | 100.0 /100 | #42 | Exceptional 22.7% |
| Osage | 100.0 /100 | #43 | Exceptional 22.7% |
| Cheyenne | 100.0 /100 | #44 | Exceptional 22.7% |
| Ute | 100.0 /100 | #45 | Exceptional 22.7% |
| Americans | 100.0 /100 | #46 | Exceptional 22.6% |
| Malaysians | 100.0 /100 | #47 | Exceptional 22.6% |
| Scottish | 100.0 /100 | #48 | Exceptional 22.6% |
| Scotch-Irish | 100.0 /100 | #49 | Exceptional 22.6% |
| Sioux | 100.0 /100 | #50 | Exceptional 22.6% |
Demographics Similar to Immigrants from Venezuela by 3 or more Vehicles in Household
In terms of 3 or more vehicles in household, the demographic groups most similar to Immigrants from Venezuela are Immigrants from Bulgaria (17.7%, a difference of 0.010%), Macedonian (17.7%, a difference of 0.050%), Immigrants from Panama (17.7%, a difference of 0.080%), Cambodian (17.8%, a difference of 0.21%), and Bermudan (17.8%, a difference of 0.24%).
| Demographics | Rating | Rank | 3 or more Vehicles in Household |
| Ugandans | 0.9 /100 | #260 | Tragic 17.8% |
| Immigrants | Northern Africa | 0.9 /100 | #261 | Tragic 17.8% |
| Colombians | 0.9 /100 | #262 | Tragic 17.8% |
| Bermudans | 0.9 /100 | #263 | Tragic 17.8% |
| Cambodians | 0.9 /100 | #264 | Tragic 17.8% |
| Immigrants | Panama | 0.8 /100 | #265 | Tragic 17.7% |
| Macedonians | 0.8 /100 | #266 | Tragic 17.7% |
| Immigrants | Venezuela | 0.8 /100 | #267 | Tragic 17.7% |
| Immigrants | Bulgaria | 0.8 /100 | #268 | Tragic 17.7% |
| Immigrants | France | 0.6 /100 | #269 | Tragic 17.6% |
| Immigrants | Nepal | 0.6 /100 | #270 | Tragic 17.6% |
| South Americans | 0.6 /100 | #271 | Tragic 17.6% |
| Immigrants | Africa | 0.5 /100 | #272 | Tragic 17.6% |
| Immigrants | Sudan | 0.5 /100 | #273 | Tragic 17.6% |
| Immigrants | Bosnia and Herzegovina | 0.5 /100 | #274 | Tragic 17.5% |