Okinawan vs Immigrants from Kenya 1 or more Vehicles in Household
COMPARE
Okinawan
Immigrants from Kenya
1 or more Vehicles in Household
1 or more Vehicles in Household Comparison
Okinawans
Immigrants from Kenya
86.1%
1 OR MORE VEHICLES IN HOUSEHOLD
0.0/ 100
METRIC RATING
292nd/ 347
METRIC RANK
90.4%
1 OR MORE VEHICLES IN HOUSEHOLD
88.5/ 100
METRIC RATING
131st/ 347
METRIC RANK
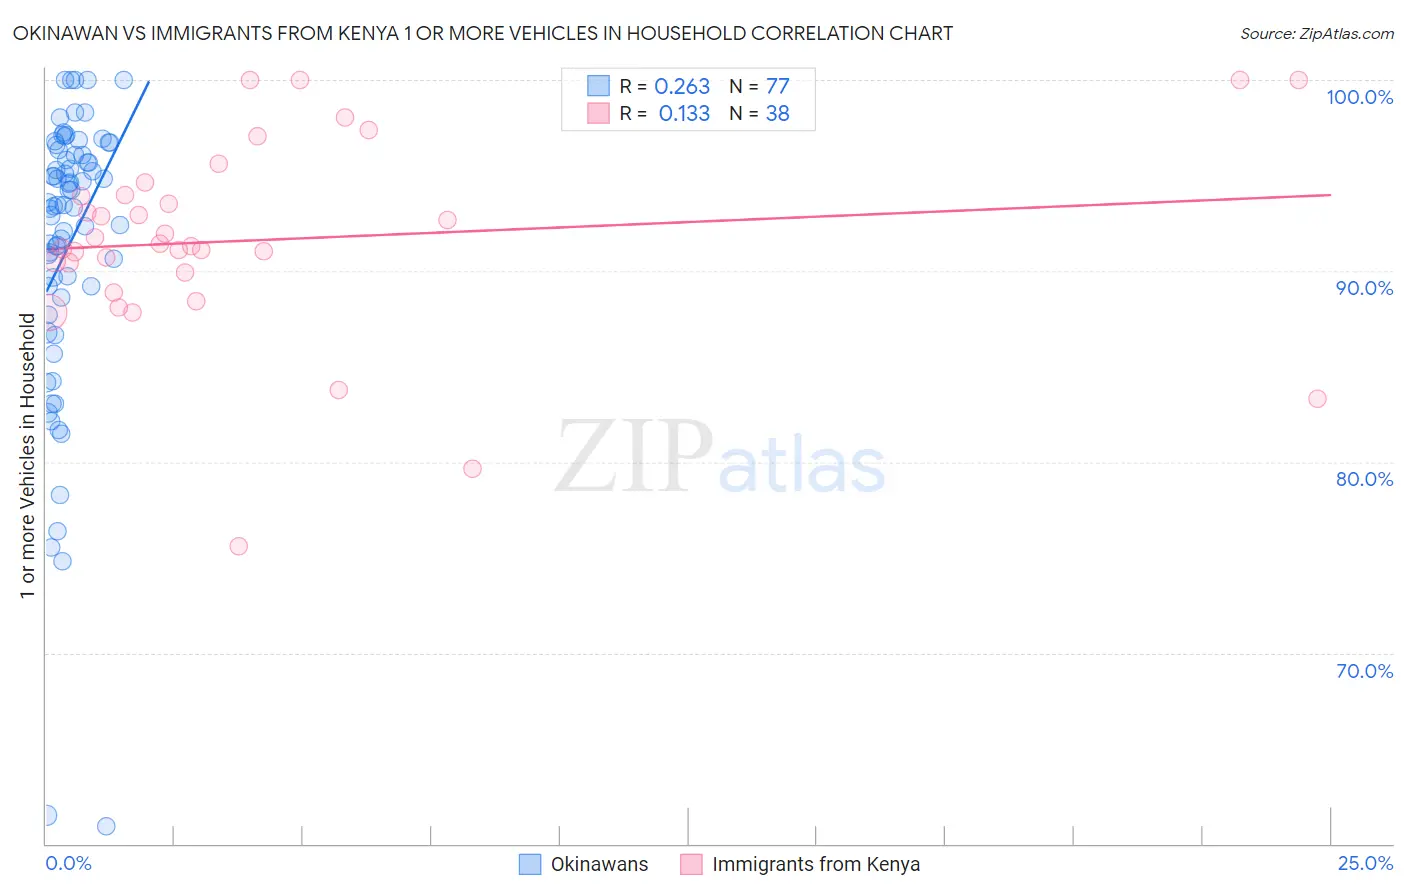
Okinawan vs Immigrants from Kenya 1 or more Vehicles in Household Correlation Chart
The statistical analysis conducted on geographies consisting of 73,660,740 people shows a weak positive correlation between the proportion of Okinawans and percentage of households with 1 or more vehicles available in the United States with a correlation coefficient (R) of 0.263 and weighted average of 86.1%. Similarly, the statistical analysis conducted on geographies consisting of 217,997,711 people shows a poor positive correlation between the proportion of Immigrants from Kenya and percentage of households with 1 or more vehicles available in the United States with a correlation coefficient (R) of 0.133 and weighted average of 90.4%, a difference of 5.0%.
1 or more Vehicles in Household Correlation Summary
| Measurement | Okinawan | Immigrants from Kenya |
| Minimum | 60.9% | 75.6% |
| Maximum | 100.0% | 100.0% |
| Range | 39.1% | 24.4% |
| Mean | 91.2% | 91.6% |
| Median | 93.4% | 91.4% |
| Interquartile 25% (IQ1) | 88.9% | 89.9% |
| Interquartile 75% (IQ3) | 96.2% | 94.0% |
| Interquartile Range (IQR) | 7.3% | 4.1% |
| Standard Deviation (Sample) | 7.8% | 5.3% |
| Standard Deviation (Population) | 7.7% | 5.2% |
Similar Demographics by 1 or more Vehicles in Household
Demographics Similar to Okinawans by 1 or more Vehicles in Household
In terms of 1 or more vehicles in household, the demographic groups most similar to Okinawans are Indian (Asian) (86.0%, a difference of 0.060%), Alaskan Athabascan (86.0%, a difference of 0.13%), Pima (86.3%, a difference of 0.23%), Immigrants from Jamaica (85.8%, a difference of 0.30%), and Immigrants from Australia (86.4%, a difference of 0.31%).
| Demographics | Rating | Rank | 1 or more Vehicles in Household |
| Immigrants | Kazakhstan | 0.0 /100 | #285 | Tragic 86.6% |
| Immigrants | Eastern Asia | 0.0 /100 | #286 | Tragic 86.5% |
| Immigrants | Malaysia | 0.0 /100 | #287 | Tragic 86.5% |
| Hopi | 0.0 /100 | #288 | Tragic 86.4% |
| Immigrants | Ireland | 0.0 /100 | #289 | Tragic 86.4% |
| Immigrants | Australia | 0.0 /100 | #290 | Tragic 86.4% |
| Pima | 0.0 /100 | #291 | Tragic 86.3% |
| Okinawans | 0.0 /100 | #292 | Tragic 86.1% |
| Indians (Asian) | 0.0 /100 | #293 | Tragic 86.0% |
| Alaskan Athabascans | 0.0 /100 | #294 | Tragic 86.0% |
| Immigrants | Jamaica | 0.0 /100 | #295 | Tragic 85.8% |
| Immigrants | Spain | 0.0 /100 | #296 | Tragic 85.8% |
| Paraguayans | 0.0 /100 | #297 | Tragic 85.7% |
| Belizeans | 0.0 /100 | #298 | Tragic 85.7% |
| Yuman | 0.0 /100 | #299 | Tragic 85.5% |
Demographics Similar to Immigrants from Kenya by 1 or more Vehicles in Household
In terms of 1 or more vehicles in household, the demographic groups most similar to Immigrants from Kenya are Nicaraguan (90.4%, a difference of 0.010%), Immigrants from South Africa (90.4%, a difference of 0.010%), Immigrants from the Azores (90.4%, a difference of 0.020%), Burmese (90.4%, a difference of 0.020%), and Marshallese (90.4%, a difference of 0.020%).
| Demographics | Rating | Rank | 1 or more Vehicles in Household |
| Puget Sound Salish | 91.5 /100 | #124 | Exceptional 90.5% |
| Immigrants | Korea | 90.5 /100 | #125 | Exceptional 90.5% |
| Immigrants | Cameroon | 89.4 /100 | #126 | Excellent 90.4% |
| Immigrants | Azores | 89.1 /100 | #127 | Excellent 90.4% |
| Burmese | 89.0 /100 | #128 | Excellent 90.4% |
| Marshallese | 88.9 /100 | #129 | Excellent 90.4% |
| Nicaraguans | 88.8 /100 | #130 | Excellent 90.4% |
| Immigrants | Kenya | 88.5 /100 | #131 | Excellent 90.4% |
| Immigrants | South Africa | 88.1 /100 | #132 | Excellent 90.4% |
| Immigrants | Syria | 87.5 /100 | #133 | Excellent 90.4% |
| Kenyans | 87.0 /100 | #134 | Excellent 90.4% |
| Immigrants | Oceania | 86.9 /100 | #135 | Excellent 90.4% |
| Hungarians | 86.5 /100 | #136 | Excellent 90.3% |
| Latvians | 86.3 /100 | #137 | Excellent 90.3% |
| Syrians | 86.3 /100 | #138 | Excellent 90.3% |