Nigerian vs Immigrants from Barbados 4 or more Vehicles in Household
COMPARE
Nigerian
Immigrants from Barbados
4 or more Vehicles in Household
4 or more Vehicles in Household Comparison
Nigerians
Immigrants from Barbados
6.0%
4 OR MORE VEHICLES IN HOUSEHOLD
12.2/ 100
METRIC RATING
217th/ 347
METRIC RANK
3.6%
4 OR MORE VEHICLES IN HOUSEHOLD
0.0/ 100
METRIC RATING
340th/ 347
METRIC RANK
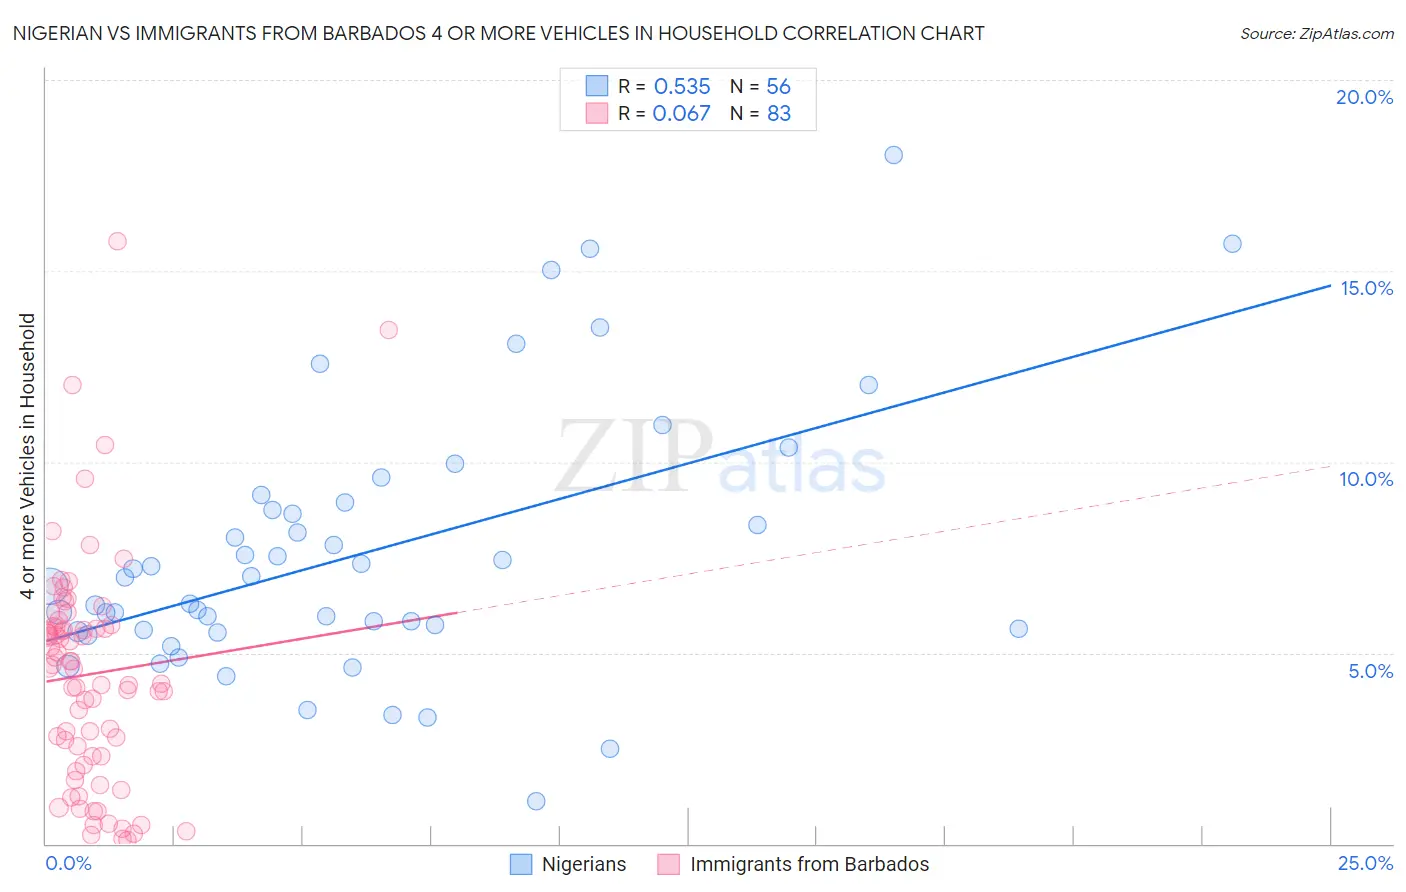
Nigerian vs Immigrants from Barbados 4 or more Vehicles in Household Correlation Chart
The statistical analysis conducted on geographies consisting of 331,155,692 people shows a substantial positive correlation between the proportion of Nigerians and percentage of households with 4 or more vehicles available in the United States with a correlation coefficient (R) of 0.535 and weighted average of 6.0%. Similarly, the statistical analysis conducted on geographies consisting of 112,222,140 people shows a slight positive correlation between the proportion of Immigrants from Barbados and percentage of households with 4 or more vehicles available in the United States with a correlation coefficient (R) of 0.067 and weighted average of 3.6%, a difference of 66.6%.
4 or more Vehicles in Household Correlation Summary
| Measurement | Nigerian | Immigrants from Barbados |
| Minimum | 1.1% | 0.11% |
| Maximum | 18.0% | 15.8% |
| Range | 16.9% | 15.7% |
| Mean | 7.6% | 4.4% |
| Median | 6.9% | 4.6% |
| Interquartile 25% (IQ1) | 5.6% | 2.3% |
| Interquartile 75% (IQ3) | 8.8% | 5.7% |
| Interquartile Range (IQR) | 3.3% | 3.4% |
| Standard Deviation (Sample) | 3.5% | 3.0% |
| Standard Deviation (Population) | 3.4% | 2.9% |
Similar Demographics by 4 or more Vehicles in Household
Demographics Similar to Nigerians by 4 or more Vehicles in Household
In terms of 4 or more vehicles in household, the demographic groups most similar to Nigerians are Immigrants from Italy (6.0%, a difference of 0.31%), Serbian (6.0%, a difference of 0.31%), Immigrants from China (6.0%, a difference of 0.39%), Immigrants from Romania (6.0%, a difference of 0.39%), and Immigrants from Austria (6.0%, a difference of 0.50%).
| Demographics | Rating | Rank | 4 or more Vehicles in Household |
| Immigrants | Zimbabwe | 15.1 /100 | #210 | Poor 6.0% |
| Panamanians | 14.8 /100 | #211 | Poor 6.0% |
| Immigrants | Egypt | 14.7 /100 | #212 | Poor 6.0% |
| Arabs | 14.4 /100 | #213 | Poor 6.0% |
| Immigrants | Austria | 14.3 /100 | #214 | Poor 6.0% |
| Immigrants | China | 13.8 /100 | #215 | Poor 6.0% |
| Immigrants | Romania | 13.8 /100 | #216 | Poor 6.0% |
| Nigerians | 12.2 /100 | #217 | Poor 6.0% |
| Immigrants | Italy | 11.0 /100 | #218 | Poor 6.0% |
| Serbians | 11.0 /100 | #219 | Poor 6.0% |
| Russians | 10.3 /100 | #220 | Poor 6.0% |
| Immigrants | Moldova | 9.3 /100 | #221 | Tragic 6.0% |
| Cajuns | 9.2 /100 | #222 | Tragic 6.0% |
| Immigrants | Kenya | 9.2 /100 | #223 | Tragic 6.0% |
| Cubans | 9.2 /100 | #224 | Tragic 6.0% |
Demographics Similar to Immigrants from Barbados by 4 or more Vehicles in Household
In terms of 4 or more vehicles in household, the demographic groups most similar to Immigrants from Barbados are Immigrants from Uzbekistan (3.6%, a difference of 0.55%), Dominican (3.5%, a difference of 2.8%), Guyanese (3.5%, a difference of 3.5%), British West Indian (3.5%, a difference of 4.5%), and Immigrants from Cabo Verde (3.8%, a difference of 5.6%).
| Demographics | Rating | Rank | 4 or more Vehicles in Household |
| Immigrants | Albania | 0.0 /100 | #333 | Tragic 4.1% |
| Immigrants | Trinidad and Tobago | 0.0 /100 | #334 | Tragic 4.1% |
| Barbadians | 0.0 /100 | #335 | Tragic 3.9% |
| Immigrants | Bangladesh | 0.0 /100 | #336 | Tragic 3.9% |
| Vietnamese | 0.0 /100 | #337 | Tragic 3.9% |
| Immigrants | Cabo Verde | 0.0 /100 | #338 | Tragic 3.8% |
| Immigrants | Uzbekistan | 0.0 /100 | #339 | Tragic 3.6% |
| Immigrants | Barbados | 0.0 /100 | #340 | Tragic 3.6% |
| Dominicans | 0.0 /100 | #341 | Tragic 3.5% |
| Guyanese | 0.0 /100 | #342 | Tragic 3.5% |
| British West Indians | 0.0 /100 | #343 | Tragic 3.5% |
| Immigrants | Guyana | 0.0 /100 | #344 | Tragic 3.4% |
| Immigrants | Dominican Republic | 0.0 /100 | #345 | Tragic 3.3% |
| Immigrants | St. Vincent and the Grenadines | 0.0 /100 | #346 | Tragic 3.0% |
| Immigrants | Grenada | 0.0 /100 | #347 | Tragic 2.7% |