Nigerian vs Cambodian 4 or more Vehicles in Household
COMPARE
Nigerian
Cambodian
4 or more Vehicles in Household
4 or more Vehicles in Household Comparison
Nigerians
Cambodians
6.0%
4 OR MORE VEHICLES IN HOUSEHOLD
12.2/ 100
METRIC RATING
217th/ 347
METRIC RANK
5.5%
4 OR MORE VEHICLES IN HOUSEHOLD
0.5/ 100
METRIC RATING
275th/ 347
METRIC RANK
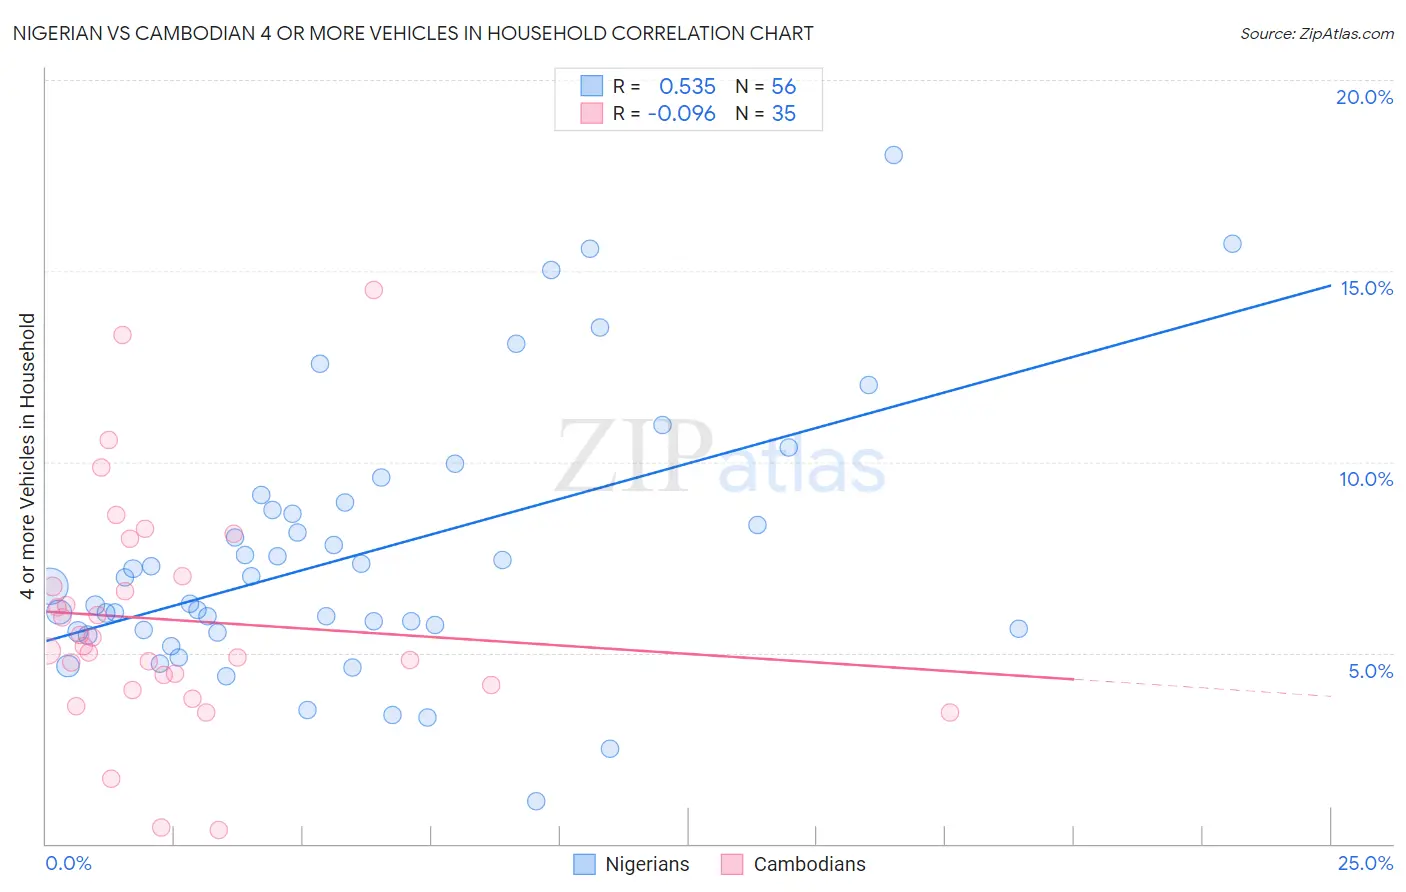
Nigerian vs Cambodian 4 or more Vehicles in Household Correlation Chart
The statistical analysis conducted on geographies consisting of 331,155,692 people shows a substantial positive correlation between the proportion of Nigerians and percentage of households with 4 or more vehicles available in the United States with a correlation coefficient (R) of 0.535 and weighted average of 6.0%. Similarly, the statistical analysis conducted on geographies consisting of 102,385,573 people shows a slight negative correlation between the proportion of Cambodians and percentage of households with 4 or more vehicles available in the United States with a correlation coefficient (R) of -0.096 and weighted average of 5.5%, a difference of 9.5%.
4 or more Vehicles in Household Correlation Summary
| Measurement | Nigerian | Cambodian |
| Minimum | 1.1% | 0.37% |
| Maximum | 18.0% | 14.5% |
| Range | 16.9% | 14.1% |
| Mean | 7.6% | 5.9% |
| Median | 6.9% | 5.2% |
| Interquartile 25% (IQ1) | 5.6% | 4.2% |
| Interquartile 75% (IQ3) | 8.8% | 7.0% |
| Interquartile Range (IQR) | 3.3% | 2.9% |
| Standard Deviation (Sample) | 3.5% | 3.0% |
| Standard Deviation (Population) | 3.4% | 3.0% |
Similar Demographics by 4 or more Vehicles in Household
Demographics Similar to Nigerians by 4 or more Vehicles in Household
In terms of 4 or more vehicles in household, the demographic groups most similar to Nigerians are Immigrants from Italy (6.0%, a difference of 0.31%), Serbian (6.0%, a difference of 0.31%), Immigrants from China (6.0%, a difference of 0.39%), Immigrants from Romania (6.0%, a difference of 0.39%), and Immigrants from Austria (6.0%, a difference of 0.50%).
| Demographics | Rating | Rank | 4 or more Vehicles in Household |
| Immigrants | Zimbabwe | 15.1 /100 | #210 | Poor 6.0% |
| Panamanians | 14.8 /100 | #211 | Poor 6.0% |
| Immigrants | Egypt | 14.7 /100 | #212 | Poor 6.0% |
| Arabs | 14.4 /100 | #213 | Poor 6.0% |
| Immigrants | Austria | 14.3 /100 | #214 | Poor 6.0% |
| Immigrants | China | 13.8 /100 | #215 | Poor 6.0% |
| Immigrants | Romania | 13.8 /100 | #216 | Poor 6.0% |
| Nigerians | 12.2 /100 | #217 | Poor 6.0% |
| Immigrants | Italy | 11.0 /100 | #218 | Poor 6.0% |
| Serbians | 11.0 /100 | #219 | Poor 6.0% |
| Russians | 10.3 /100 | #220 | Poor 6.0% |
| Immigrants | Moldova | 9.3 /100 | #221 | Tragic 6.0% |
| Cajuns | 9.2 /100 | #222 | Tragic 6.0% |
| Immigrants | Kenya | 9.2 /100 | #223 | Tragic 6.0% |
| Cubans | 9.2 /100 | #224 | Tragic 6.0% |
Demographics Similar to Cambodians by 4 or more Vehicles in Household
In terms of 4 or more vehicles in household, the demographic groups most similar to Cambodians are Immigrants from Latvia (5.5%, a difference of 0.010%), Black/African American (5.5%, a difference of 0.12%), Immigrants from Bulgaria (5.5%, a difference of 0.13%), Macedonian (5.5%, a difference of 0.24%), and Immigrants from Kazakhstan (5.5%, a difference of 0.27%).
| Demographics | Rating | Rank | 4 or more Vehicles in Household |
| Colombians | 0.7 /100 | #268 | Tragic 5.5% |
| Carpatho Rusyns | 0.7 /100 | #269 | Tragic 5.5% |
| Okinawans | 0.6 /100 | #270 | Tragic 5.5% |
| Immigrants | Sudan | 0.6 /100 | #271 | Tragic 5.5% |
| Immigrants | Kazakhstan | 0.6 /100 | #272 | Tragic 5.5% |
| Macedonians | 0.6 /100 | #273 | Tragic 5.5% |
| Blacks/African Americans | 0.6 /100 | #274 | Tragic 5.5% |
| Cambodians | 0.5 /100 | #275 | Tragic 5.5% |
| Immigrants | Latvia | 0.5 /100 | #276 | Tragic 5.5% |
| Immigrants | Bulgaria | 0.5 /100 | #277 | Tragic 5.5% |
| Immigrants | Eastern Europe | 0.4 /100 | #278 | Tragic 5.4% |
| Immigrants | Uruguay | 0.3 /100 | #279 | Tragic 5.4% |
| Alsatians | 0.3 /100 | #280 | Tragic 5.4% |
| Immigrants | Western Africa | 0.3 /100 | #281 | Tragic 5.4% |
| Immigrants | Spain | 0.3 /100 | #282 | Tragic 5.4% |