Nicaraguan vs Vietnamese 1 or more Vehicles in Household
COMPARE
Nicaraguan
Vietnamese
1 or more Vehicles in Household
1 or more Vehicles in Household Comparison
Nicaraguans
Vietnamese
90.4%
1 OR MORE VEHICLES IN HOUSEHOLD
88.8/ 100
METRIC RATING
130th/ 347
METRIC RANK
73.8%
1 OR MORE VEHICLES IN HOUSEHOLD
0.0/ 100
METRIC RATING
336th/ 347
METRIC RANK
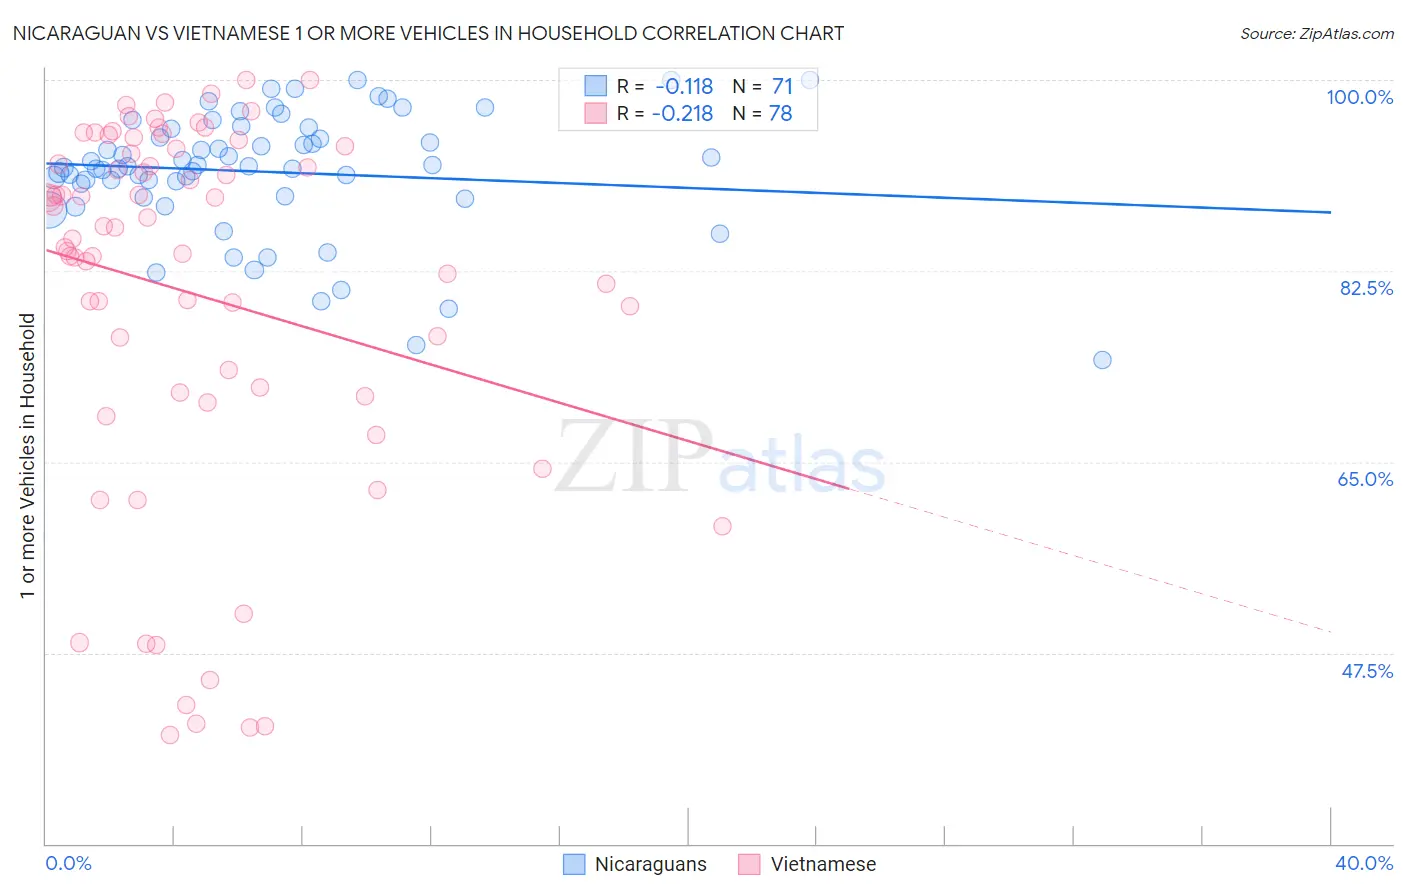
Nicaraguan vs Vietnamese 1 or more Vehicles in Household Correlation Chart
The statistical analysis conducted on geographies consisting of 285,615,163 people shows a poor negative correlation between the proportion of Nicaraguans and percentage of households with 1 or more vehicles available in the United States with a correlation coefficient (R) of -0.118 and weighted average of 90.4%. Similarly, the statistical analysis conducted on geographies consisting of 170,683,703 people shows a weak negative correlation between the proportion of Vietnamese and percentage of households with 1 or more vehicles available in the United States with a correlation coefficient (R) of -0.218 and weighted average of 73.8%, a difference of 22.5%.
1 or more Vehicles in Household Correlation Summary
| Measurement | Nicaraguan | Vietnamese |
| Minimum | 74.4% | 39.9% |
| Maximum | 100.0% | 100.0% |
| Range | 25.6% | 60.1% |
| Mean | 91.6% | 80.4% |
| Median | 92.1% | 86.0% |
| Interquartile 25% (IQ1) | 89.4% | 71.3% |
| Interquartile 75% (IQ3) | 95.5% | 93.7% |
| Interquartile Range (IQR) | 6.1% | 22.4% |
| Standard Deviation (Sample) | 5.6% | 17.1% |
| Standard Deviation (Population) | 5.6% | 17.0% |
Similar Demographics by 1 or more Vehicles in Household
Demographics Similar to Nicaraguans by 1 or more Vehicles in Household
In terms of 1 or more vehicles in household, the demographic groups most similar to Nicaraguans are Marshallese (90.4%, a difference of 0.0%), Immigrants from the Azores (90.4%, a difference of 0.010%), Burmese (90.4%, a difference of 0.010%), Immigrants from Kenya (90.4%, a difference of 0.010%), and Immigrants from Cameroon (90.4%, a difference of 0.020%).
| Demographics | Rating | Rank | 1 or more Vehicles in Household |
| Fijians | 91.8 /100 | #123 | Exceptional 90.5% |
| Puget Sound Salish | 91.5 /100 | #124 | Exceptional 90.5% |
| Immigrants | Korea | 90.5 /100 | #125 | Exceptional 90.5% |
| Immigrants | Cameroon | 89.4 /100 | #126 | Excellent 90.4% |
| Immigrants | Azores | 89.1 /100 | #127 | Excellent 90.4% |
| Burmese | 89.0 /100 | #128 | Excellent 90.4% |
| Marshallese | 88.9 /100 | #129 | Excellent 90.4% |
| Nicaraguans | 88.8 /100 | #130 | Excellent 90.4% |
| Immigrants | Kenya | 88.5 /100 | #131 | Excellent 90.4% |
| Immigrants | South Africa | 88.1 /100 | #132 | Excellent 90.4% |
| Immigrants | Syria | 87.5 /100 | #133 | Excellent 90.4% |
| Kenyans | 87.0 /100 | #134 | Excellent 90.4% |
| Immigrants | Oceania | 86.9 /100 | #135 | Excellent 90.4% |
| Hungarians | 86.5 /100 | #136 | Excellent 90.3% |
| Latvians | 86.3 /100 | #137 | Excellent 90.3% |
Demographics Similar to Vietnamese by 1 or more Vehicles in Household
In terms of 1 or more vehicles in household, the demographic groups most similar to Vietnamese are Barbadian (74.0%, a difference of 0.21%), Immigrants from Uzbekistan (73.4%, a difference of 0.62%), Immigrants from Bangladesh (74.3%, a difference of 0.65%), Inupiat (71.5%, a difference of 3.2%), and Immigrants from Ecuador (76.2%, a difference of 3.3%).
| Demographics | Rating | Rank | 1 or more Vehicles in Household |
| Immigrants | Dominica | 0.0 /100 | #329 | Tragic 77.8% |
| Immigrants | Trinidad and Tobago | 0.0 /100 | #330 | Tragic 76.8% |
| West Indians | 0.0 /100 | #331 | Tragic 76.4% |
| Trinidadians and Tobagonians | 0.0 /100 | #332 | Tragic 76.3% |
| Immigrants | Ecuador | 0.0 /100 | #333 | Tragic 76.2% |
| Immigrants | Bangladesh | 0.0 /100 | #334 | Tragic 74.3% |
| Barbadians | 0.0 /100 | #335 | Tragic 74.0% |
| Vietnamese | 0.0 /100 | #336 | Tragic 73.8% |
| Immigrants | Uzbekistan | 0.0 /100 | #337 | Tragic 73.4% |
| Inupiat | 0.0 /100 | #338 | Tragic 71.5% |
| Guyanese | 0.0 /100 | #339 | Tragic 70.8% |
| Dominicans | 0.0 /100 | #340 | Tragic 70.7% |
| Immigrants | Barbados | 0.0 /100 | #341 | Tragic 70.6% |
| Immigrants | Guyana | 0.0 /100 | #342 | Tragic 70.6% |
| British West Indians | 0.0 /100 | #343 | Tragic 70.4% |