Nicaraguan vs Tohono O'odham 1 or more Vehicles in Household
COMPARE
Nicaraguan
Tohono O'odham
1 or more Vehicles in Household
1 or more Vehicles in Household Comparison
Nicaraguans
Tohono O'odham
90.4%
1 OR MORE VEHICLES IN HOUSEHOLD
88.8/ 100
METRIC RATING
130th/ 347
METRIC RANK
84.7%
1 OR MORE VEHICLES IN HOUSEHOLD
0.0/ 100
METRIC RATING
307th/ 347
METRIC RANK
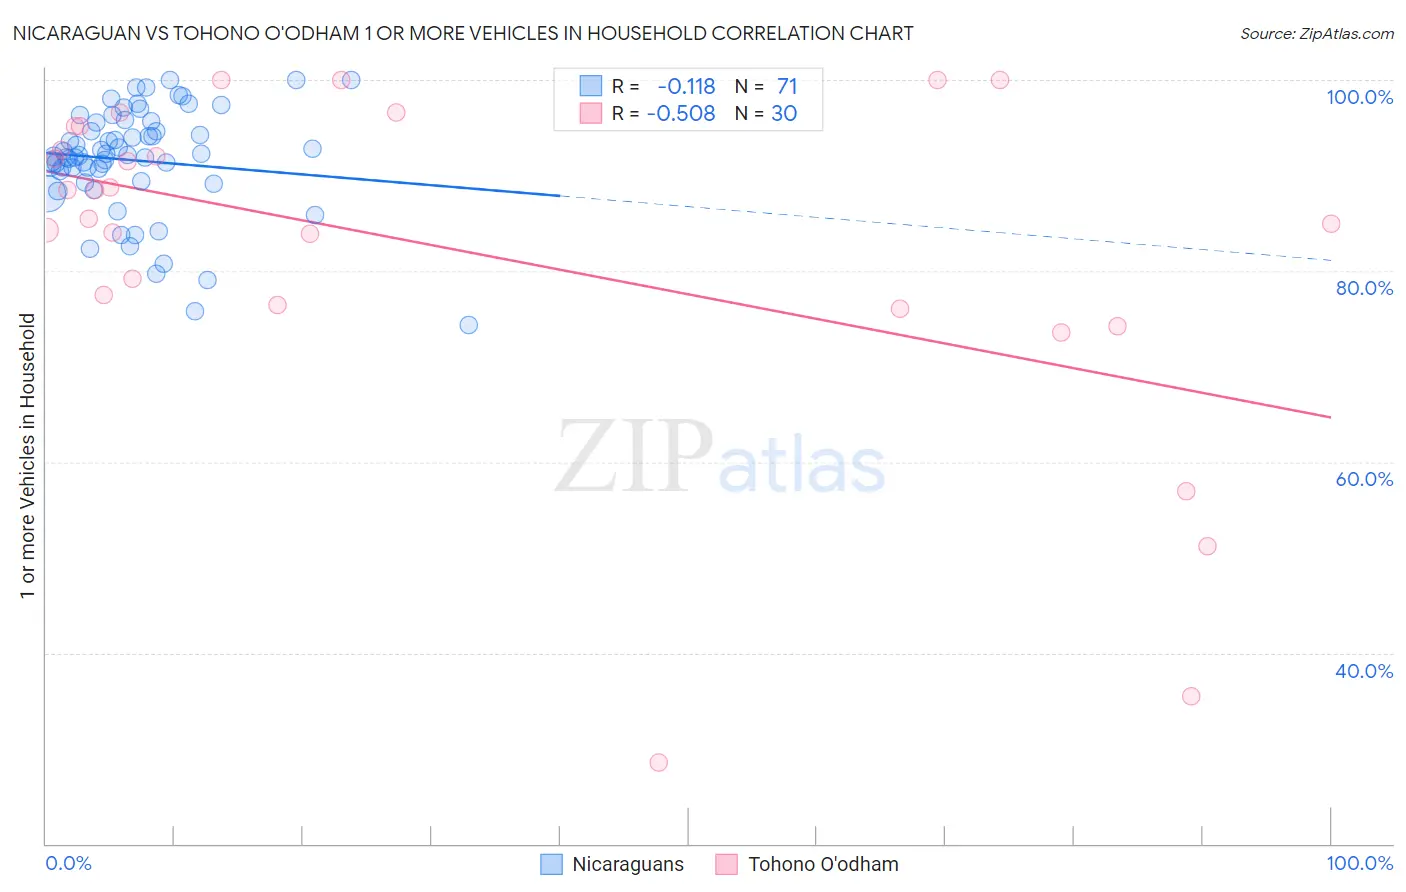
Nicaraguan vs Tohono O'odham 1 or more Vehicles in Household Correlation Chart
The statistical analysis conducted on geographies consisting of 285,615,163 people shows a poor negative correlation between the proportion of Nicaraguans and percentage of households with 1 or more vehicles available in the United States with a correlation coefficient (R) of -0.118 and weighted average of 90.4%. Similarly, the statistical analysis conducted on geographies consisting of 58,718,905 people shows a substantial negative correlation between the proportion of Tohono O'odham and percentage of households with 1 or more vehicles available in the United States with a correlation coefficient (R) of -0.508 and weighted average of 84.7%, a difference of 6.8%.
1 or more Vehicles in Household Correlation Summary
| Measurement | Nicaraguan | Tohono O'odham |
| Minimum | 74.4% | 28.6% |
| Maximum | 100.0% | 100.0% |
| Range | 25.6% | 71.4% |
| Mean | 91.6% | 82.3% |
| Median | 92.1% | 86.9% |
| Interquartile 25% (IQ1) | 89.4% | 76.4% |
| Interquartile 75% (IQ3) | 95.5% | 95.1% |
| Interquartile Range (IQR) | 6.1% | 18.7% |
| Standard Deviation (Sample) | 5.6% | 18.1% |
| Standard Deviation (Population) | 5.6% | 17.8% |
Similar Demographics by 1 or more Vehicles in Household
Demographics Similar to Nicaraguans by 1 or more Vehicles in Household
In terms of 1 or more vehicles in household, the demographic groups most similar to Nicaraguans are Marshallese (90.4%, a difference of 0.0%), Immigrants from the Azores (90.4%, a difference of 0.010%), Burmese (90.4%, a difference of 0.010%), Immigrants from Kenya (90.4%, a difference of 0.010%), and Immigrants from Cameroon (90.4%, a difference of 0.020%).
| Demographics | Rating | Rank | 1 or more Vehicles in Household |
| Fijians | 91.8 /100 | #123 | Exceptional 90.5% |
| Puget Sound Salish | 91.5 /100 | #124 | Exceptional 90.5% |
| Immigrants | Korea | 90.5 /100 | #125 | Exceptional 90.5% |
| Immigrants | Cameroon | 89.4 /100 | #126 | Excellent 90.4% |
| Immigrants | Azores | 89.1 /100 | #127 | Excellent 90.4% |
| Burmese | 89.0 /100 | #128 | Excellent 90.4% |
| Marshallese | 88.9 /100 | #129 | Excellent 90.4% |
| Nicaraguans | 88.8 /100 | #130 | Excellent 90.4% |
| Immigrants | Kenya | 88.5 /100 | #131 | Excellent 90.4% |
| Immigrants | South Africa | 88.1 /100 | #132 | Excellent 90.4% |
| Immigrants | Syria | 87.5 /100 | #133 | Excellent 90.4% |
| Kenyans | 87.0 /100 | #134 | Excellent 90.4% |
| Immigrants | Oceania | 86.9 /100 | #135 | Excellent 90.4% |
| Hungarians | 86.5 /100 | #136 | Excellent 90.3% |
| Latvians | 86.3 /100 | #137 | Excellent 90.3% |
Demographics Similar to Tohono O'odham by 1 or more Vehicles in Household
In terms of 1 or more vehicles in household, the demographic groups most similar to Tohono O'odham are Immigrants from Belize (84.7%, a difference of 0.030%), Immigrants from Haiti (84.7%, a difference of 0.040%), U.S. Virgin Islander (84.6%, a difference of 0.070%), Puerto Rican (84.6%, a difference of 0.11%), and Cape Verdean (84.5%, a difference of 0.22%).
| Demographics | Rating | Rank | 1 or more Vehicles in Household |
| Immigrants | Russia | 0.0 /100 | #300 | Tragic 85.4% |
| Immigrants | Panama | 0.0 /100 | #301 | Tragic 85.4% |
| Moroccans | 0.0 /100 | #302 | Tragic 85.4% |
| Immigrants | Greece | 0.0 /100 | #303 | Tragic 85.4% |
| Immigrants | Ukraine | 0.0 /100 | #304 | Tragic 85.2% |
| Immigrants | China | 0.0 /100 | #305 | Tragic 84.9% |
| Immigrants | Western Africa | 0.0 /100 | #306 | Tragic 84.9% |
| Tohono O'odham | 0.0 /100 | #307 | Tragic 84.7% |
| Immigrants | Belize | 0.0 /100 | #308 | Tragic 84.7% |
| Immigrants | Haiti | 0.0 /100 | #309 | Tragic 84.7% |
| U.S. Virgin Islanders | 0.0 /100 | #310 | Tragic 84.6% |
| Puerto Ricans | 0.0 /100 | #311 | Tragic 84.6% |
| Cape Verdeans | 0.0 /100 | #312 | Tragic 84.5% |
| Immigrants | Israel | 0.0 /100 | #313 | Tragic 84.5% |
| Albanians | 0.0 /100 | #314 | Tragic 84.4% |