New Zealander vs Estonian Unemployment Among Ages 60 to 64 years
COMPARE
New Zealander
Estonian
Unemployment Among Ages 60 to 64 years
Unemployment Among Ages 60 to 64 years Comparison
New Zealanders
Estonians
4.9%
UNEMPLOYMENT AMONG AGES 60 TO 64 YEARS
17.4/ 100
METRIC RATING
206th/ 347
METRIC RANK
5.1%
UNEMPLOYMENT AMONG AGES 60 TO 64 YEARS
0.8/ 100
METRIC RATING
255th/ 347
METRIC RANK
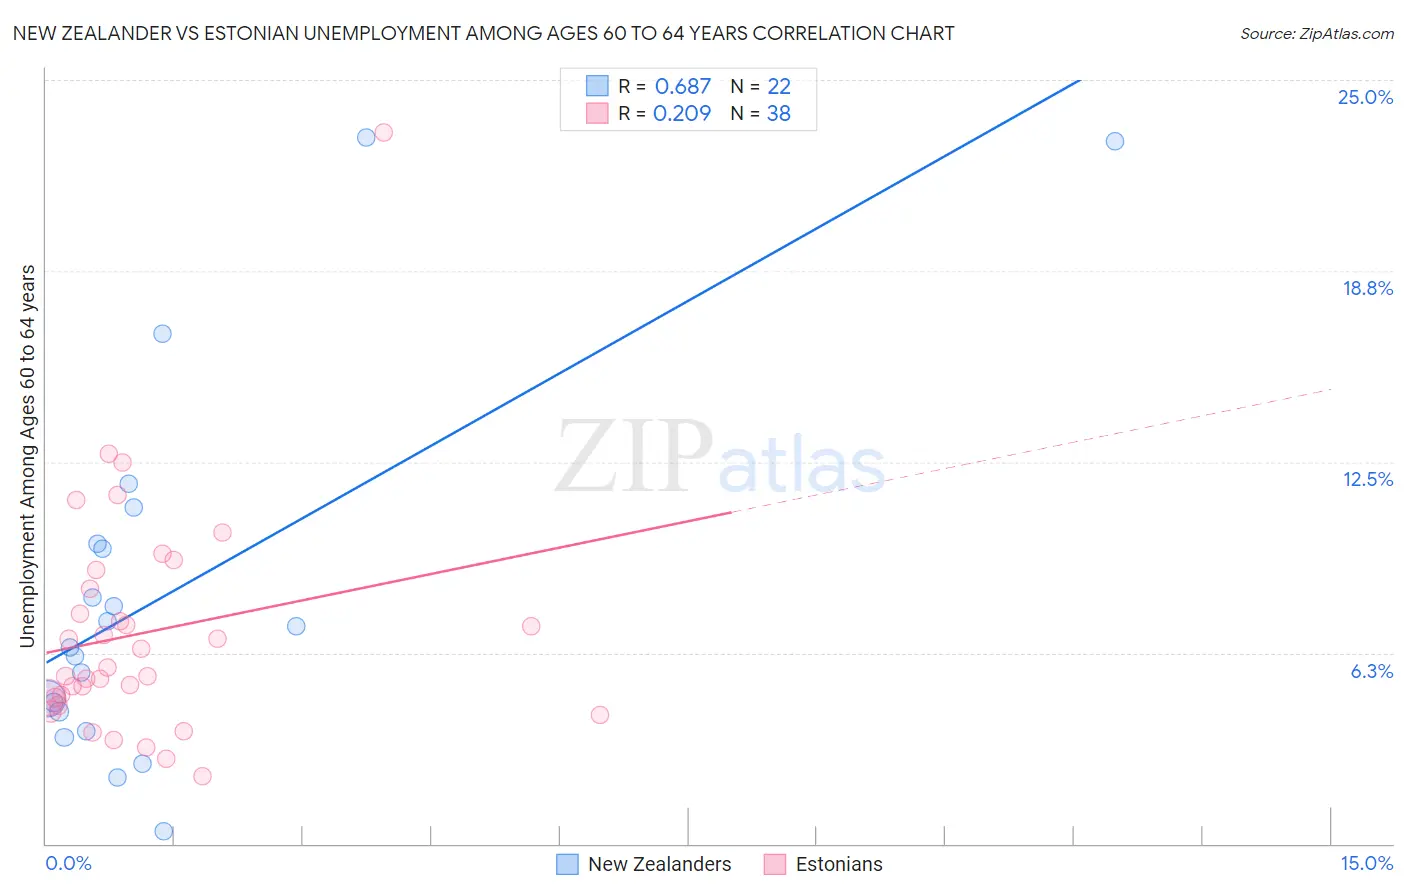
New Zealander vs Estonian Unemployment Among Ages 60 to 64 years Correlation Chart
The statistical analysis conducted on geographies consisting of 102,928,930 people shows a significant positive correlation between the proportion of New Zealanders and unemployment rate among population between the ages 60 and 64 in the United States with a correlation coefficient (R) of 0.687 and weighted average of 4.9%. Similarly, the statistical analysis conducted on geographies consisting of 118,962,162 people shows a weak positive correlation between the proportion of Estonians and unemployment rate among population between the ages 60 and 64 in the United States with a correlation coefficient (R) of 0.209 and weighted average of 5.1%, a difference of 2.8%.
Unemployment Among Ages 60 to 64 years Correlation Summary
| Measurement | New Zealander | Estonian |
| Minimum | 0.40% | 2.2% |
| Maximum | 23.1% | 23.3% |
| Range | 22.7% | 21.1% |
| Mean | 8.2% | 6.9% |
| Median | 6.8% | 5.6% |
| Interquartile 25% (IQ1) | 4.3% | 4.8% |
| Interquartile 75% (IQ3) | 9.8% | 8.3% |
| Interquartile Range (IQR) | 5.5% | 3.6% |
| Standard Deviation (Sample) | 6.0% | 3.8% |
| Standard Deviation (Population) | 5.9% | 3.8% |
Similar Demographics by Unemployment Among Ages 60 to 64 years
Demographics Similar to New Zealanders by Unemployment Among Ages 60 to 64 years
In terms of unemployment among ages 60 to 64 years, the demographic groups most similar to New Zealanders are Immigrants from Indonesia (4.9%, a difference of 0.0%), Chippewa (4.9%, a difference of 0.010%), German Russian (4.9%, a difference of 0.040%), Sierra Leonean (4.9%, a difference of 0.060%), and Russian (4.9%, a difference of 0.080%).
| Demographics | Rating | Rank | Unemployment Among Ages 60 to 64 years |
| Immigrants | Vietnam | 23.7 /100 | #199 | Fair 4.9% |
| Immigrants | Czechoslovakia | 23.5 /100 | #200 | Fair 4.9% |
| Colombians | 22.7 /100 | #201 | Fair 4.9% |
| Immigrants | Western Africa | 20.6 /100 | #202 | Fair 4.9% |
| Uruguayans | 19.9 /100 | #203 | Poor 4.9% |
| Russians | 18.9 /100 | #204 | Poor 4.9% |
| Immigrants | Indonesia | 17.4 /100 | #205 | Poor 4.9% |
| New Zealanders | 17.4 /100 | #206 | Poor 4.9% |
| Chippewa | 17.3 /100 | #207 | Poor 4.9% |
| German Russians | 16.8 /100 | #208 | Poor 4.9% |
| Sierra Leoneans | 16.5 /100 | #209 | Poor 4.9% |
| Cherokee | 16.1 /100 | #210 | Poor 4.9% |
| Blackfeet | 15.7 /100 | #211 | Poor 4.9% |
| Moroccans | 15.0 /100 | #212 | Poor 4.9% |
| Eastern Europeans | 14.3 /100 | #213 | Poor 4.9% |
Demographics Similar to Estonians by Unemployment Among Ages 60 to 64 years
In terms of unemployment among ages 60 to 64 years, the demographic groups most similar to Estonians are Costa Rican (5.1%, a difference of 0.010%), Immigrants from China (5.1%, a difference of 0.040%), Immigrants from Switzerland (5.1%, a difference of 0.080%), Immigrants from Uruguay (5.1%, a difference of 0.090%), and Immigrants from Peru (5.1%, a difference of 0.12%).
| Demographics | Rating | Rank | Unemployment Among Ages 60 to 64 years |
| Immigrants | Fiji | 1.1 /100 | #248 | Tragic 5.1% |
| South Americans | 1.0 /100 | #249 | Tragic 5.1% |
| Immigrants | Cambodia | 0.9 /100 | #250 | Tragic 5.1% |
| Immigrants | Uruguay | 0.9 /100 | #251 | Tragic 5.1% |
| Immigrants | Switzerland | 0.9 /100 | #252 | Tragic 5.1% |
| Immigrants | China | 0.9 /100 | #253 | Tragic 5.1% |
| Costa Ricans | 0.8 /100 | #254 | Tragic 5.1% |
| Estonians | 0.8 /100 | #255 | Tragic 5.1% |
| Immigrants | Peru | 0.7 /100 | #256 | Tragic 5.1% |
| Japanese | 0.6 /100 | #257 | Tragic 5.1% |
| Celtics | 0.5 /100 | #258 | Tragic 5.1% |
| Hondurans | 0.5 /100 | #259 | Tragic 5.1% |
| Immigrants | Honduras | 0.4 /100 | #260 | Tragic 5.1% |
| Immigrants | Ghana | 0.4 /100 | #261 | Tragic 5.1% |
| Immigrants | Uzbekistan | 0.4 /100 | #262 | Tragic 5.1% |