Native/Alaskan vs Cypriot 1 or more Vehicles in Household
COMPARE
Native/Alaskan
Cypriot
1 or more Vehicles in Household
1 or more Vehicles in Household Comparison
Natives/Alaskans
Cypriots
89.8%
1 OR MORE VEHICLES IN HOUSEHOLD
59.5/ 100
METRIC RATING
169th/ 347
METRIC RANK
84.4%
1 OR MORE VEHICLES IN HOUSEHOLD
0.0/ 100
METRIC RATING
315th/ 347
METRIC RANK
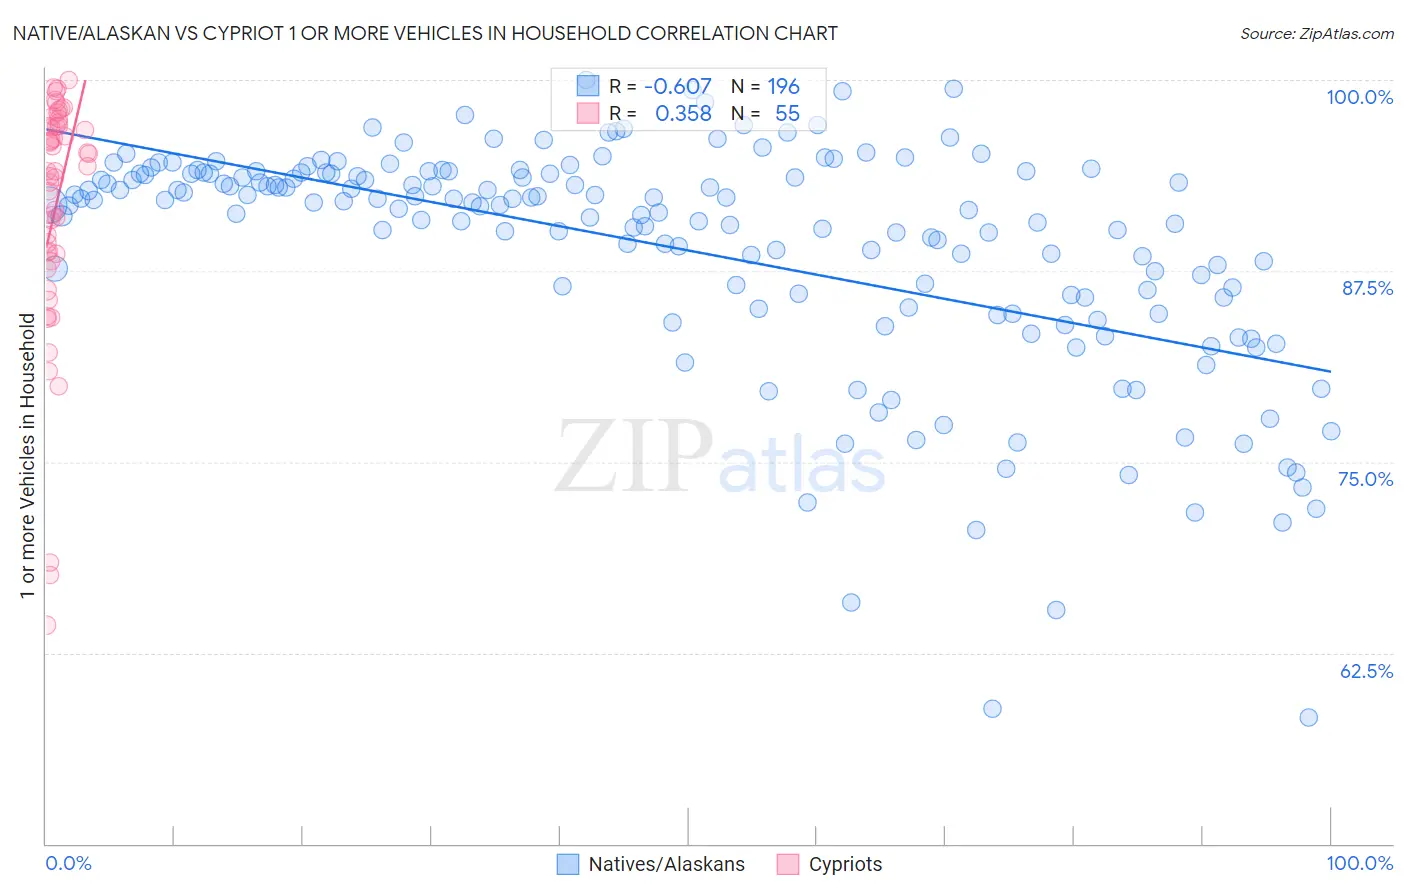
Native/Alaskan vs Cypriot 1 or more Vehicles in Household Correlation Chart
The statistical analysis conducted on geographies consisting of 512,700,478 people shows a significant negative correlation between the proportion of Natives/Alaskans and percentage of households with 1 or more vehicles available in the United States with a correlation coefficient (R) of -0.607 and weighted average of 89.8%. Similarly, the statistical analysis conducted on geographies consisting of 61,854,678 people shows a mild positive correlation between the proportion of Cypriots and percentage of households with 1 or more vehicles available in the United States with a correlation coefficient (R) of 0.358 and weighted average of 84.4%, a difference of 6.5%.
1 or more Vehicles in Household Correlation Summary
| Measurement | Native/Alaskan | Cypriot |
| Minimum | 58.3% | 64.3% |
| Maximum | 100.0% | 100.0% |
| Range | 41.7% | 35.7% |
| Mean | 88.9% | 91.6% |
| Median | 91.8% | 94.0% |
| Interquartile 25% (IQ1) | 85.8% | 88.6% |
| Interquartile 75% (IQ3) | 93.9% | 97.0% |
| Interquartile Range (IQR) | 8.1% | 8.4% |
| Standard Deviation (Sample) | 7.6% | 8.0% |
| Standard Deviation (Population) | 7.6% | 7.9% |
Similar Demographics by 1 or more Vehicles in Household
Demographics Similar to Natives/Alaskans by 1 or more Vehicles in Household
In terms of 1 or more vehicles in household, the demographic groups most similar to Natives/Alaskans are Immigrants from Latin America (89.8%, a difference of 0.010%), Immigrants from Cambodia (89.8%, a difference of 0.010%), Immigrants from Costa Rica (89.8%, a difference of 0.030%), Immigrants from Middle Africa (89.9%, a difference of 0.040%), and Immigrants from Saudi Arabia (89.9%, a difference of 0.050%).
| Demographics | Rating | Rank | 1 or more Vehicles in Household |
| Spanish American Indians | 67.0 /100 | #162 | Good 89.9% |
| Immigrants | Austria | 65.5 /100 | #163 | Good 89.9% |
| Comanche | 63.4 /100 | #164 | Good 89.9% |
| Immigrants | Saudi Arabia | 62.6 /100 | #165 | Good 89.9% |
| Immigrants | Middle Africa | 62.2 /100 | #166 | Good 89.9% |
| Immigrants | Latin America | 60.3 /100 | #167 | Good 89.8% |
| Immigrants | Cambodia | 60.1 /100 | #168 | Good 89.8% |
| Natives/Alaskans | 59.5 /100 | #169 | Average 89.8% |
| Immigrants | Costa Rica | 57.6 /100 | #170 | Average 89.8% |
| French American Indians | 54.4 /100 | #171 | Average 89.8% |
| Indonesians | 53.0 /100 | #172 | Average 89.7% |
| Lumbee | 52.8 /100 | #173 | Average 89.7% |
| Filipinos | 50.0 /100 | #174 | Average 89.7% |
| Immigrants | Burma/Myanmar | 47.6 /100 | #175 | Average 89.7% |
| Immigrants | Sudan | 47.1 /100 | #176 | Average 89.7% |
Demographics Similar to Cypriots by 1 or more Vehicles in Household
In terms of 1 or more vehicles in household, the demographic groups most similar to Cypriots are Albanian (84.4%, a difference of 0.070%), Immigrants from Israel (84.5%, a difference of 0.13%), Cape Verdean (84.5%, a difference of 0.16%), Puerto Rican (84.6%, a difference of 0.27%), and U.S. Virgin Islander (84.6%, a difference of 0.30%).
| Demographics | Rating | Rank | 1 or more Vehicles in Household |
| Immigrants | Belize | 0.0 /100 | #308 | Tragic 84.7% |
| Immigrants | Haiti | 0.0 /100 | #309 | Tragic 84.7% |
| U.S. Virgin Islanders | 0.0 /100 | #310 | Tragic 84.6% |
| Puerto Ricans | 0.0 /100 | #311 | Tragic 84.6% |
| Cape Verdeans | 0.0 /100 | #312 | Tragic 84.5% |
| Immigrants | Israel | 0.0 /100 | #313 | Tragic 84.5% |
| Albanians | 0.0 /100 | #314 | Tragic 84.4% |
| Cypriots | 0.0 /100 | #315 | Tragic 84.4% |
| Alaska Natives | 0.0 /100 | #316 | Tragic 83.8% |
| Ghanaians | 0.0 /100 | #317 | Tragic 83.6% |
| Immigrants | Ghana | 0.0 /100 | #318 | Tragic 83.4% |
| Immigrants | Belarus | 0.0 /100 | #319 | Tragic 83.3% |
| Soviet Union | 0.0 /100 | #320 | Tragic 82.7% |
| Jamaicans | 0.0 /100 | #321 | Tragic 82.1% |
| Immigrants | Cabo Verde | 0.0 /100 | #322 | Tragic 81.6% |