Native/Alaskan vs Immigrants from North Macedonia 1 or more Vehicles in Household
COMPARE
Native/Alaskan
Immigrants from North Macedonia
1 or more Vehicles in Household
1 or more Vehicles in Household Comparison
Natives/Alaskans
Immigrants from North Macedonia
89.8%
1 OR MORE VEHICLES IN HOUSEHOLD
59.5/ 100
METRIC RATING
169th/ 347
METRIC RANK
89.5%
1 OR MORE VEHICLES IN HOUSEHOLD
36.5/ 100
METRIC RATING
192nd/ 347
METRIC RANK
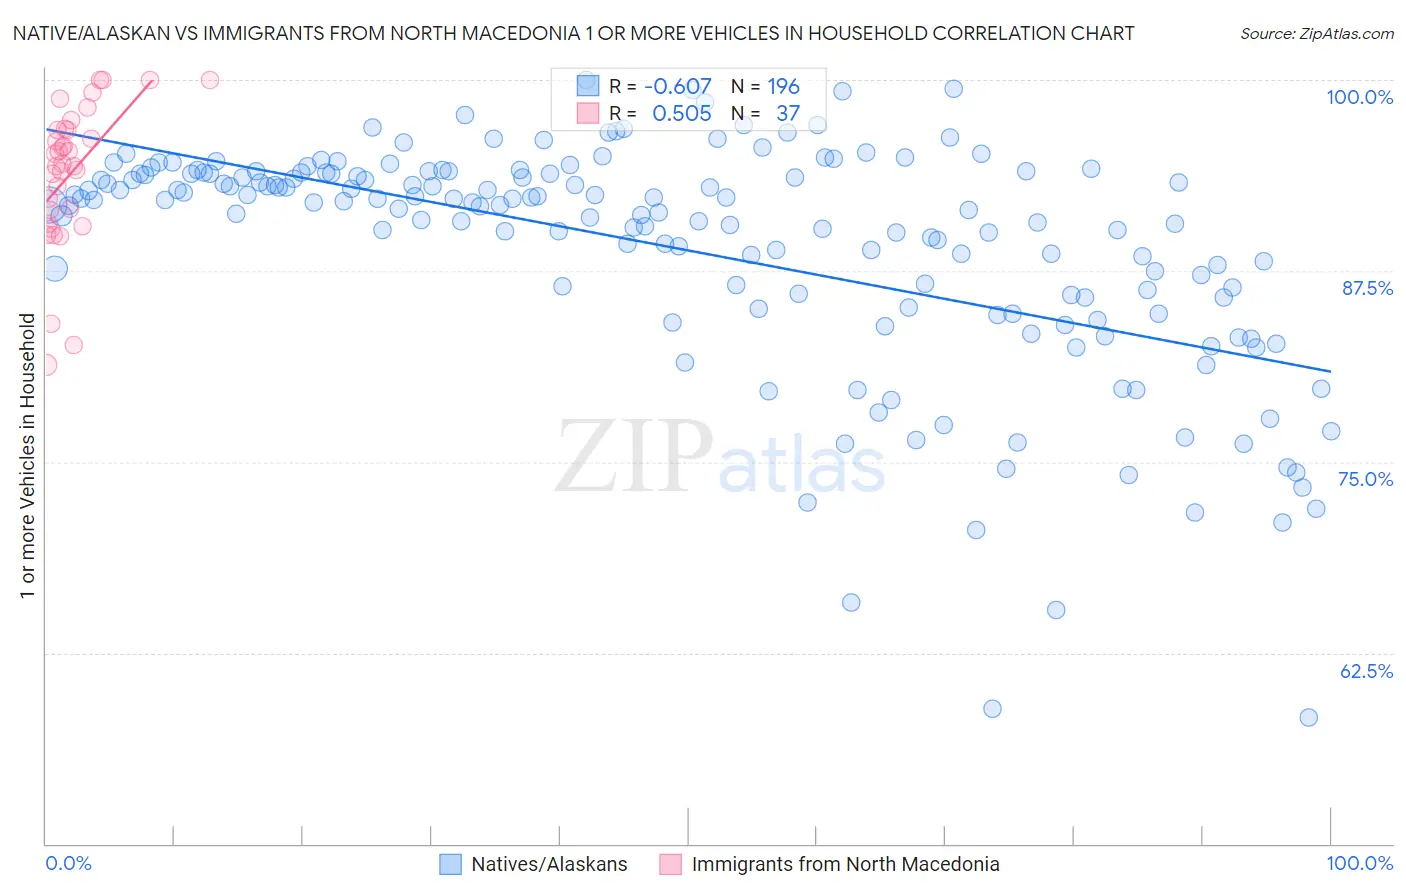
Native/Alaskan vs Immigrants from North Macedonia 1 or more Vehicles in Household Correlation Chart
The statistical analysis conducted on geographies consisting of 512,700,478 people shows a significant negative correlation between the proportion of Natives/Alaskans and percentage of households with 1 or more vehicles available in the United States with a correlation coefficient (R) of -0.607 and weighted average of 89.8%. Similarly, the statistical analysis conducted on geographies consisting of 74,050,012 people shows a substantial positive correlation between the proportion of Immigrants from North Macedonia and percentage of households with 1 or more vehicles available in the United States with a correlation coefficient (R) of 0.505 and weighted average of 89.5%, a difference of 0.36%.
1 or more Vehicles in Household Correlation Summary
| Measurement | Native/Alaskan | Immigrants from North Macedonia |
| Minimum | 58.3% | 81.4% |
| Maximum | 100.0% | 100.0% |
| Range | 41.7% | 18.6% |
| Mean | 88.9% | 93.9% |
| Median | 91.8% | 94.5% |
| Interquartile 25% (IQ1) | 85.8% | 91.1% |
| Interquartile 75% (IQ3) | 93.9% | 96.8% |
| Interquartile Range (IQR) | 8.1% | 5.7% |
| Standard Deviation (Sample) | 7.6% | 4.6% |
| Standard Deviation (Population) | 7.6% | 4.5% |
Similar Demographics by 1 or more Vehicles in Household
Demographics Similar to Natives/Alaskans by 1 or more Vehicles in Household
In terms of 1 or more vehicles in household, the demographic groups most similar to Natives/Alaskans are Immigrants from Latin America (89.8%, a difference of 0.010%), Immigrants from Cambodia (89.8%, a difference of 0.010%), Immigrants from Costa Rica (89.8%, a difference of 0.030%), Immigrants from Middle Africa (89.9%, a difference of 0.040%), and Immigrants from Saudi Arabia (89.9%, a difference of 0.050%).
| Demographics | Rating | Rank | 1 or more Vehicles in Household |
| Spanish American Indians | 67.0 /100 | #162 | Good 89.9% |
| Immigrants | Austria | 65.5 /100 | #163 | Good 89.9% |
| Comanche | 63.4 /100 | #164 | Good 89.9% |
| Immigrants | Saudi Arabia | 62.6 /100 | #165 | Good 89.9% |
| Immigrants | Middle Africa | 62.2 /100 | #166 | Good 89.9% |
| Immigrants | Latin America | 60.3 /100 | #167 | Good 89.8% |
| Immigrants | Cambodia | 60.1 /100 | #168 | Good 89.8% |
| Natives/Alaskans | 59.5 /100 | #169 | Average 89.8% |
| Immigrants | Costa Rica | 57.6 /100 | #170 | Average 89.8% |
| French American Indians | 54.4 /100 | #171 | Average 89.8% |
| Indonesians | 53.0 /100 | #172 | Average 89.7% |
| Lumbee | 52.8 /100 | #173 | Average 89.7% |
| Filipinos | 50.0 /100 | #174 | Average 89.7% |
| Immigrants | Burma/Myanmar | 47.6 /100 | #175 | Average 89.7% |
| Immigrants | Sudan | 47.1 /100 | #176 | Average 89.7% |
Demographics Similar to Immigrants from North Macedonia by 1 or more Vehicles in Household
In terms of 1 or more vehicles in household, the demographic groups most similar to Immigrants from North Macedonia are Immigrants from Poland (89.5%, a difference of 0.010%), Carpatho Rusyn (89.5%, a difference of 0.020%), Shoshone (89.5%, a difference of 0.020%), Immigrants from Northern Europe (89.5%, a difference of 0.020%), and Immigrants from Nepal (89.5%, a difference of 0.040%).
| Demographics | Rating | Rank | 1 or more Vehicles in Household |
| Immigrants | Brazil | 40.1 /100 | #185 | Average 89.6% |
| Pueblo | 39.9 /100 | #186 | Fair 89.6% |
| South Americans | 39.6 /100 | #187 | Fair 89.5% |
| Immigrants | Nepal | 38.9 /100 | #188 | Fair 89.5% |
| Carpatho Rusyns | 37.8 /100 | #189 | Fair 89.5% |
| Shoshone | 37.5 /100 | #190 | Fair 89.5% |
| Immigrants | Poland | 37.1 /100 | #191 | Fair 89.5% |
| Immigrants | North Macedonia | 36.5 /100 | #192 | Fair 89.5% |
| Immigrants | Northern Europe | 35.5 /100 | #193 | Fair 89.5% |
| Immigrants | Eritrea | 33.2 /100 | #194 | Fair 89.4% |
| Immigrants | Armenia | 31.8 /100 | #195 | Fair 89.4% |
| Crow | 24.3 /100 | #196 | Fair 89.3% |
| Immigrants | Sweden | 23.6 /100 | #197 | Fair 89.3% |
| Pennsylvania Germans | 22.9 /100 | #198 | Fair 89.3% |
| Immigrants | Asia | 22.8 /100 | #199 | Fair 89.3% |