Native Hawaiian vs Puerto Rican 1 or more Vehicles in Household
COMPARE
Native Hawaiian
Puerto Rican
1 or more Vehicles in Household
1 or more Vehicles in Household Comparison
Native Hawaiians
Puerto Ricans
92.4%
1 OR MORE VEHICLES IN HOUSEHOLD
100.0/ 100
METRIC RATING
29th/ 347
METRIC RANK
84.6%
1 OR MORE VEHICLES IN HOUSEHOLD
0.0/ 100
METRIC RATING
311th/ 347
METRIC RANK
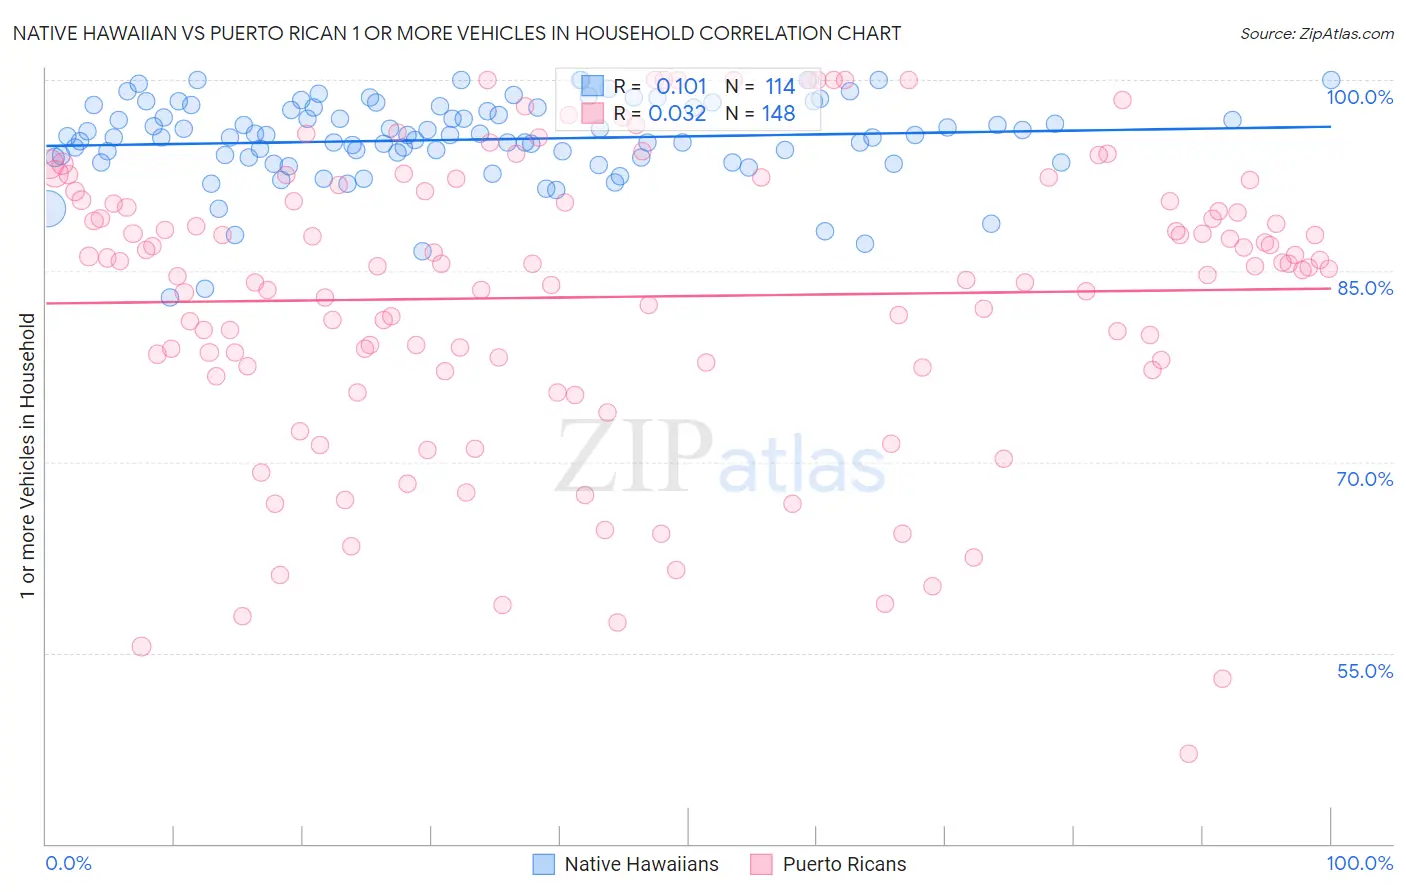
Native Hawaiian vs Puerto Rican 1 or more Vehicles in Household Correlation Chart
The statistical analysis conducted on geographies consisting of 331,859,591 people shows a poor positive correlation between the proportion of Native Hawaiians and percentage of households with 1 or more vehicles available in the United States with a correlation coefficient (R) of 0.101 and weighted average of 92.4%. Similarly, the statistical analysis conducted on geographies consisting of 527,808,789 people shows no correlation between the proportion of Puerto Ricans and percentage of households with 1 or more vehicles available in the United States with a correlation coefficient (R) of 0.032 and weighted average of 84.6%, a difference of 9.3%.
1 or more Vehicles in Household Correlation Summary
| Measurement | Native Hawaiian | Puerto Rican |
| Minimum | 82.9% | 47.0% |
| Maximum | 100.0% | 100.0% |
| Range | 17.1% | 53.0% |
| Mean | 95.3% | 83.0% |
| Median | 95.6% | 85.3% |
| Interquartile 25% (IQ1) | 93.9% | 77.6% |
| Interquartile 75% (IQ3) | 97.8% | 90.5% |
| Interquartile Range (IQR) | 3.9% | 12.8% |
| Standard Deviation (Sample) | 3.3% | 11.4% |
| Standard Deviation (Population) | 3.3% | 11.4% |
Similar Demographics by 1 or more Vehicles in Household
Demographics Similar to Native Hawaiians by 1 or more Vehicles in Household
In terms of 1 or more vehicles in household, the demographic groups most similar to Native Hawaiians are Finnish (92.4%, a difference of 0.0%), Sri Lankan (92.5%, a difference of 0.010%), Samoan (92.4%, a difference of 0.010%), American (92.5%, a difference of 0.050%), and Basque (92.4%, a difference of 0.050%).
| Demographics | Rating | Rank | 1 or more Vehicles in Household |
| French | 100.0 /100 | #22 | Exceptional 92.7% |
| Nepalese | 100.0 /100 | #23 | Exceptional 92.6% |
| Yaqui | 100.0 /100 | #24 | Exceptional 92.6% |
| Immigrants | Iraq | 100.0 /100 | #25 | Exceptional 92.5% |
| British | 100.0 /100 | #26 | Exceptional 92.5% |
| Americans | 100.0 /100 | #27 | Exceptional 92.5% |
| Sri Lankans | 100.0 /100 | #28 | Exceptional 92.5% |
| Native Hawaiians | 100.0 /100 | #29 | Exceptional 92.4% |
| Finns | 100.0 /100 | #30 | Exceptional 92.4% |
| Samoans | 100.0 /100 | #31 | Exceptional 92.4% |
| Basques | 100.0 /100 | #32 | Exceptional 92.4% |
| Cherokee | 100.0 /100 | #33 | Exceptional 92.4% |
| Italians | 99.9 /100 | #34 | Exceptional 92.3% |
| Czechoslovakians | 99.9 /100 | #35 | Exceptional 92.3% |
| Malaysians | 99.9 /100 | #36 | Exceptional 92.3% |
Demographics Similar to Puerto Ricans by 1 or more Vehicles in Household
In terms of 1 or more vehicles in household, the demographic groups most similar to Puerto Ricans are U.S. Virgin Islander (84.6%, a difference of 0.040%), Immigrants from Haiti (84.7%, a difference of 0.070%), Immigrants from Belize (84.7%, a difference of 0.080%), Tohono O'odham (84.7%, a difference of 0.11%), and Cape Verdean (84.5%, a difference of 0.11%).
| Demographics | Rating | Rank | 1 or more Vehicles in Household |
| Immigrants | Ukraine | 0.0 /100 | #304 | Tragic 85.2% |
| Immigrants | China | 0.0 /100 | #305 | Tragic 84.9% |
| Immigrants | Western Africa | 0.0 /100 | #306 | Tragic 84.9% |
| Tohono O'odham | 0.0 /100 | #307 | Tragic 84.7% |
| Immigrants | Belize | 0.0 /100 | #308 | Tragic 84.7% |
| Immigrants | Haiti | 0.0 /100 | #309 | Tragic 84.7% |
| U.S. Virgin Islanders | 0.0 /100 | #310 | Tragic 84.6% |
| Puerto Ricans | 0.0 /100 | #311 | Tragic 84.6% |
| Cape Verdeans | 0.0 /100 | #312 | Tragic 84.5% |
| Immigrants | Israel | 0.0 /100 | #313 | Tragic 84.5% |
| Albanians | 0.0 /100 | #314 | Tragic 84.4% |
| Cypriots | 0.0 /100 | #315 | Tragic 84.4% |
| Alaska Natives | 0.0 /100 | #316 | Tragic 83.8% |
| Ghanaians | 0.0 /100 | #317 | Tragic 83.6% |
| Immigrants | Ghana | 0.0 /100 | #318 | Tragic 83.4% |