Mongolian vs Immigrants from Nicaragua 2 or more Vehicles in Household
COMPARE
Mongolian
Immigrants from Nicaragua
2 or more Vehicles in Household
2 or more Vehicles in Household Comparison
Mongolians
Immigrants from Nicaragua
52.8%
2 OR MORE VEHICLES IN HOUSEHOLD
1.0/ 100
METRIC RATING
250th/ 347
METRIC RANK
55.4%
2 OR MORE VEHICLES IN HOUSEHOLD
51.6/ 100
METRIC RATING
172nd/ 347
METRIC RANK
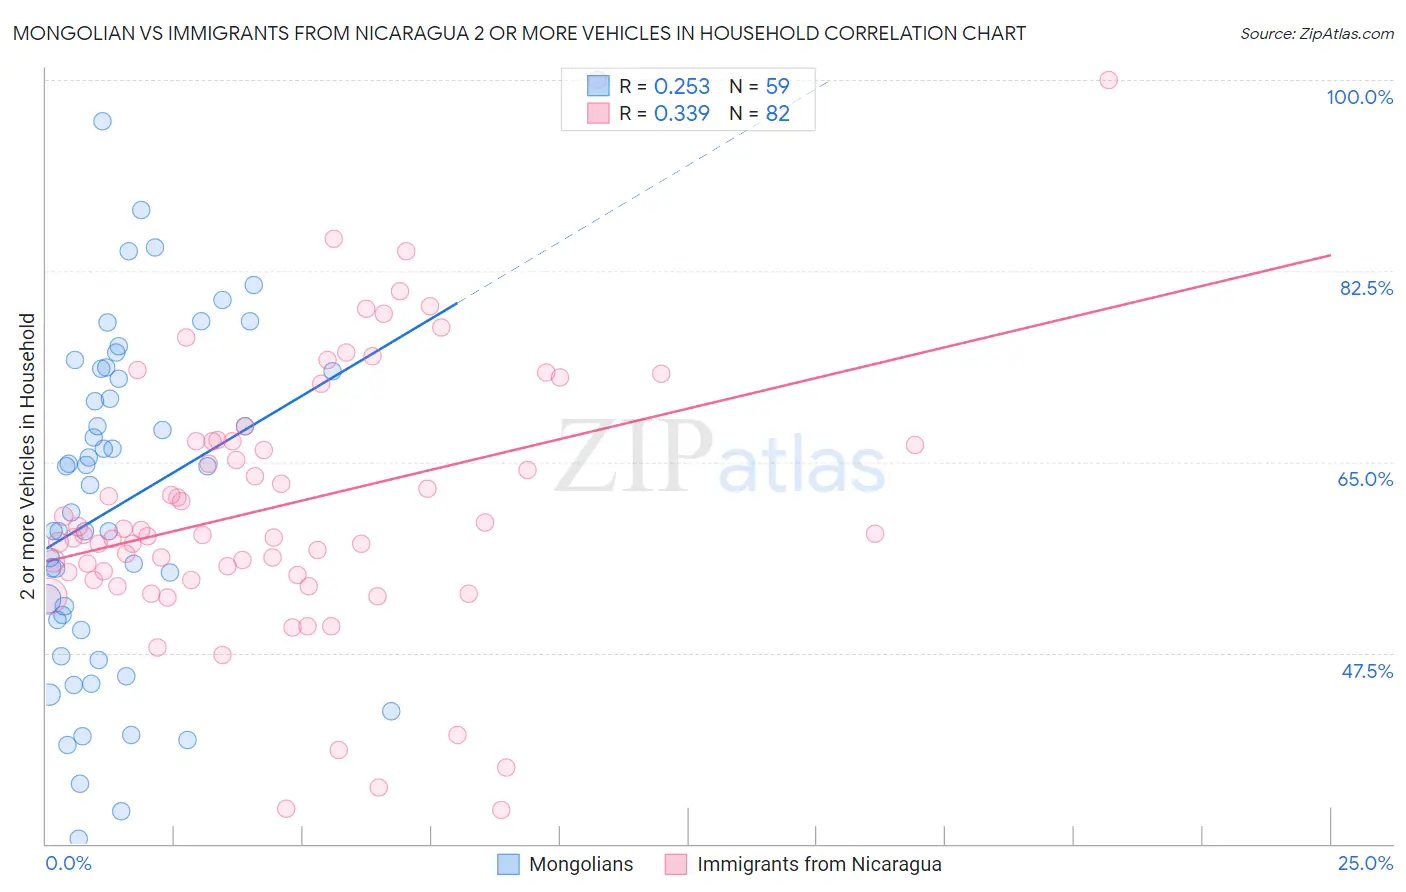
Mongolian vs Immigrants from Nicaragua 2 or more Vehicles in Household Correlation Chart
The statistical analysis conducted on geographies consisting of 140,284,468 people shows a weak positive correlation between the proportion of Mongolians and percentage of households with 2 or more vehicles available in the United States with a correlation coefficient (R) of 0.253 and weighted average of 52.8%. Similarly, the statistical analysis conducted on geographies consisting of 236,314,206 people shows a mild positive correlation between the proportion of Immigrants from Nicaragua and percentage of households with 2 or more vehicles available in the United States with a correlation coefficient (R) of 0.339 and weighted average of 55.4%, a difference of 4.9%.
2 or more Vehicles in Household Correlation Summary
| Measurement | Mongolian | Immigrants from Nicaragua |
| Minimum | 30.5% | 33.1% |
| Maximum | 96.2% | 100.0% |
| Range | 65.7% | 66.9% |
| Mean | 61.0% | 61.2% |
| Median | 62.9% | 58.4% |
| Interquartile 25% (IQ1) | 49.5% | 54.6% |
| Interquartile 75% (IQ3) | 73.3% | 66.9% |
| Interquartile Range (IQR) | 23.7% | 12.3% |
| Standard Deviation (Sample) | 15.0% | 12.7% |
| Standard Deviation (Population) | 14.9% | 12.6% |
Similar Demographics by 2 or more Vehicles in Household
Demographics Similar to Mongolians by 2 or more Vehicles in Household
In terms of 2 or more vehicles in household, the demographic groups most similar to Mongolians are Immigrants from Brazil (52.8%, a difference of 0.0%), Immigrants from Sudan (52.8%, a difference of 0.030%), Immigrants from Portugal (52.8%, a difference of 0.050%), Colombian (52.9%, a difference of 0.060%), and Nigerian (52.8%, a difference of 0.10%).
| Demographics | Rating | Rank | 2 or more Vehicles in Household |
| Ethiopians | 1.7 /100 | #243 | Tragic 53.1% |
| Indians (Asian) | 1.7 /100 | #244 | Tragic 53.1% |
| Immigrants | Ethiopia | 1.5 /100 | #245 | Tragic 53.0% |
| Immigrants | Nigeria | 1.2 /100 | #246 | Tragic 52.9% |
| Sierra Leoneans | 1.2 /100 | #247 | Tragic 52.9% |
| Colombians | 1.1 /100 | #248 | Tragic 52.9% |
| Immigrants | Brazil | 1.0 /100 | #249 | Tragic 52.8% |
| Mongolians | 1.0 /100 | #250 | Tragic 52.8% |
| Immigrants | Sudan | 1.0 /100 | #251 | Tragic 52.8% |
| Immigrants | Portugal | 1.0 /100 | #252 | Tragic 52.8% |
| Nigerians | 0.9 /100 | #253 | Tragic 52.8% |
| Immigrants | Malaysia | 0.8 /100 | #254 | Tragic 52.7% |
| Uruguayans | 0.7 /100 | #255 | Tragic 52.7% |
| Immigrants | Eritrea | 0.7 /100 | #256 | Tragic 52.6% |
| Immigrants | Hong Kong | 0.6 /100 | #257 | Tragic 52.6% |
Demographics Similar to Immigrants from Nicaragua by 2 or more Vehicles in Household
In terms of 2 or more vehicles in household, the demographic groups most similar to Immigrants from Nicaragua are Immigrants from Western Europe (55.4%, a difference of 0.010%), Navajo (55.3%, a difference of 0.070%), Immigrants from Denmark (55.3%, a difference of 0.090%), Immigrants from Costa Rica (55.4%, a difference of 0.11%), and Romanian (55.5%, a difference of 0.17%).
| Demographics | Rating | Rank | 2 or more Vehicles in Household |
| Immigrants | El Salvador | 59.4 /100 | #165 | Average 55.6% |
| Immigrants | Sri Lanka | 58.3 /100 | #166 | Average 55.5% |
| Kenyans | 58.1 /100 | #167 | Average 55.5% |
| French American Indians | 56.7 /100 | #168 | Average 55.5% |
| Immigrants | Austria | 56.3 /100 | #169 | Average 55.5% |
| Romanians | 55.8 /100 | #170 | Average 55.5% |
| Immigrants | Costa Rica | 54.4 /100 | #171 | Average 55.4% |
| Immigrants | Nicaragua | 51.6 /100 | #172 | Average 55.4% |
| Immigrants | Western Europe | 51.4 /100 | #173 | Average 55.4% |
| Navajo | 50.0 /100 | #174 | Average 55.3% |
| Immigrants | Denmark | 49.4 /100 | #175 | Average 55.3% |
| Immigrants | Cuba | 47.0 /100 | #176 | Average 55.3% |
| Menominee | 46.2 /100 | #177 | Average 55.3% |
| Immigrants | Sweden | 45.3 /100 | #178 | Average 55.2% |
| Alaskan Athabascans | 42.9 /100 | #179 | Average 55.2% |