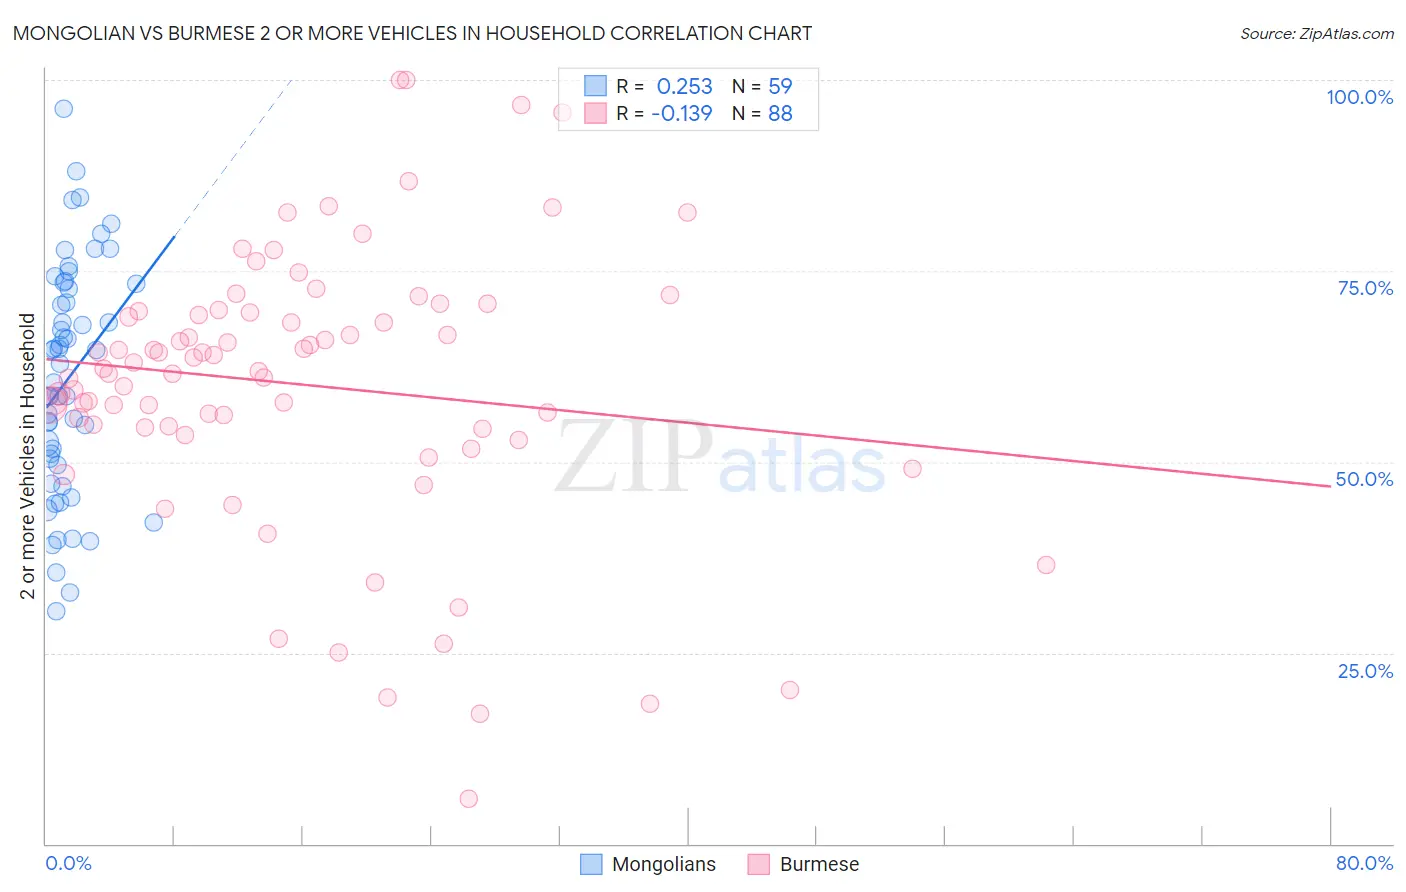
Mongolian vs Burmese 2 or more Vehicles in Household
COMPARE
Mongolian
Burmese
2 or more Vehicles in Household
2 or more Vehicles in Household Comparison
Mongolians
Burmese
52.8%
2 OR MORE VEHICLES IN HOUSEHOLD
1.0/ 100
METRIC RATING
250th/ 347
METRIC RANK
57.8%
2 OR MORE VEHICLES IN HOUSEHOLD
98.8/ 100
METRIC RATING
96th/ 347
METRIC RANK
Mongolian vs Burmese 2 or more Vehicles in Household Correlation Chart
The statistical analysis conducted on geographies consisting of 140,284,468 people shows a weak positive correlation between the proportion of Mongolians and percentage of households with 2 or more vehicles available in the United States with a correlation coefficient (R) of 0.253 and weighted average of 52.8%. Similarly, the statistical analysis conducted on geographies consisting of 464,950,170 people shows a poor negative correlation between the proportion of Burmese and percentage of households with 2 or more vehicles available in the United States with a correlation coefficient (R) of -0.139 and weighted average of 57.8%, a difference of 9.4%.
2 or more Vehicles in Household Correlation Summary
| Measurement | Mongolian | Burmese |
| Minimum | 30.5% | 5.9% |
| Maximum | 96.2% | 100.0% |
| Range | 65.7% | 94.1% |
| Mean | 61.0% | 60.1% |
| Median | 62.9% | 62.0% |
| Interquartile 25% (IQ1) | 49.5% | 54.5% |
| Interquartile 75% (IQ3) | 73.3% | 69.7% |
| Interquartile Range (IQR) | 23.7% | 15.2% |
| Standard Deviation (Sample) | 15.0% | 18.3% |
| Standard Deviation (Population) | 14.9% | 18.2% |
Similar Demographics by 2 or more Vehicles in Household
Demographics Similar to Mongolians by 2 or more Vehicles in Household
In terms of 2 or more vehicles in household, the demographic groups most similar to Mongolians are Immigrants from Brazil (52.8%, a difference of 0.0%), Immigrants from Sudan (52.8%, a difference of 0.030%), Immigrants from Portugal (52.8%, a difference of 0.050%), Colombian (52.9%, a difference of 0.060%), and Nigerian (52.8%, a difference of 0.10%).
| Demographics | Rating | Rank | 2 or more Vehicles in Household |
| Ethiopians | 1.7 /100 | #243 | Tragic 53.1% |
| Indians (Asian) | 1.7 /100 | #244 | Tragic 53.1% |
| Immigrants | Ethiopia | 1.5 /100 | #245 | Tragic 53.0% |
| Immigrants | Nigeria | 1.2 /100 | #246 | Tragic 52.9% |
| Sierra Leoneans | 1.2 /100 | #247 | Tragic 52.9% |
| Colombians | 1.1 /100 | #248 | Tragic 52.9% |
| Immigrants | Brazil | 1.0 /100 | #249 | Tragic 52.8% |
| Mongolians | 1.0 /100 | #250 | Tragic 52.8% |
| Immigrants | Sudan | 1.0 /100 | #251 | Tragic 52.8% |
| Immigrants | Portugal | 1.0 /100 | #252 | Tragic 52.8% |
| Nigerians | 0.9 /100 | #253 | Tragic 52.8% |
| Immigrants | Malaysia | 0.8 /100 | #254 | Tragic 52.7% |
| Uruguayans | 0.7 /100 | #255 | Tragic 52.7% |
| Immigrants | Eritrea | 0.7 /100 | #256 | Tragic 52.6% |
| Immigrants | Hong Kong | 0.6 /100 | #257 | Tragic 52.6% |
Demographics Similar to Burmese by 2 or more Vehicles in Household
In terms of 2 or more vehicles in household, the demographic groups most similar to Burmese are Slavic (57.8%, a difference of 0.020%), Hmong (57.8%, a difference of 0.030%), Filipino (57.8%, a difference of 0.060%), Shoshone (57.9%, a difference of 0.12%), and Ottawa (57.9%, a difference of 0.12%).
| Demographics | Rating | Rank | 2 or more Vehicles in Household |
| Immigrants | Germany | 99.0 /100 | #89 | Exceptional 57.9% |
| Hispanics or Latinos | 99.0 /100 | #90 | Exceptional 57.9% |
| Pakistanis | 99.0 /100 | #91 | Exceptional 57.9% |
| Shoshone | 99.0 /100 | #92 | Exceptional 57.9% |
| Ottawa | 99.0 /100 | #93 | Exceptional 57.9% |
| Filipinos | 98.9 /100 | #94 | Exceptional 57.8% |
| Hmong | 98.9 /100 | #95 | Exceptional 57.8% |
| Burmese | 98.8 /100 | #96 | Exceptional 57.8% |
| Slavs | 98.8 /100 | #97 | Exceptional 57.8% |
| Palestinians | 98.6 /100 | #98 | Exceptional 57.7% |
| Cajuns | 98.5 /100 | #99 | Exceptional 57.7% |
| Fijians | 98.4 /100 | #100 | Exceptional 57.6% |
| Lebanese | 98.3 /100 | #101 | Exceptional 57.6% |
| Immigrants | Bolivia | 98.2 /100 | #102 | Exceptional 57.6% |
| Jordanians | 98.2 /100 | #103 | Exceptional 57.6% |