Marshallese vs Sierra Leonean 4 or more Vehicles in Household
COMPARE
Marshallese
Sierra Leonean
4 or more Vehicles in Household
4 or more Vehicles in Household Comparison
Marshallese
Sierra Leoneans
8.1%
4 OR MORE VEHICLES IN HOUSEHOLD
100.0/ 100
METRIC RATING
32nd/ 347
METRIC RANK
5.9%
4 OR MORE VEHICLES IN HOUSEHOLD
6.0/ 100
METRIC RATING
233rd/ 347
METRIC RANK
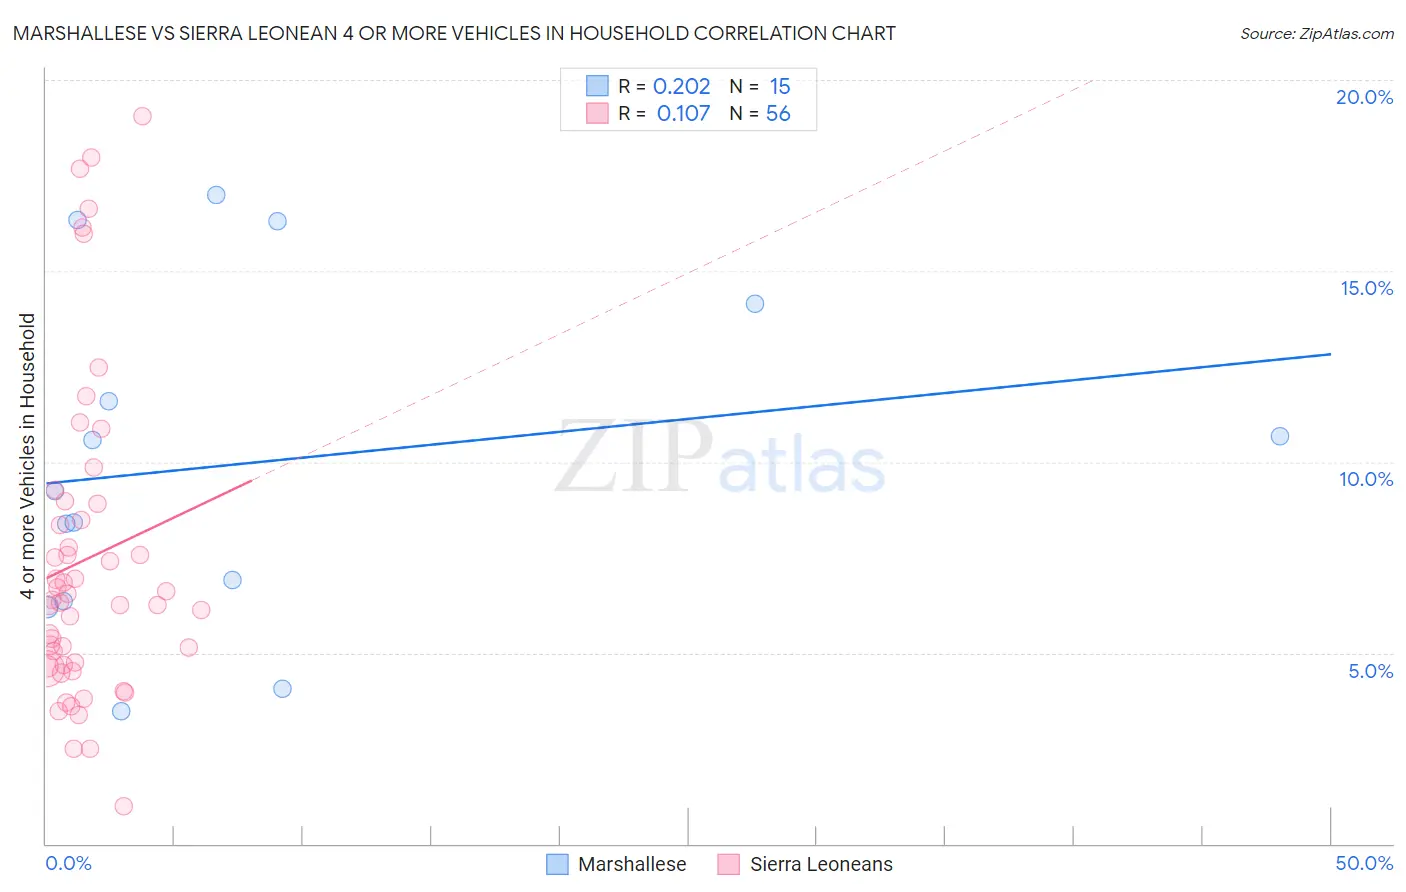
Marshallese vs Sierra Leonean 4 or more Vehicles in Household Correlation Chart
The statistical analysis conducted on geographies consisting of 14,760,409 people shows a weak positive correlation between the proportion of Marshallese and percentage of households with 4 or more vehicles available in the United States with a correlation coefficient (R) of 0.202 and weighted average of 8.1%. Similarly, the statistical analysis conducted on geographies consisting of 83,069,082 people shows a poor positive correlation between the proportion of Sierra Leoneans and percentage of households with 4 or more vehicles available in the United States with a correlation coefficient (R) of 0.107 and weighted average of 5.9%, a difference of 38.4%.
4 or more Vehicles in Household Correlation Summary
| Measurement | Marshallese | Sierra Leonean |
| Minimum | 3.5% | 0.97% |
| Maximum | 17.0% | 19.1% |
| Range | 13.5% | 18.1% |
| Mean | 10.0% | 7.4% |
| Median | 9.2% | 6.4% |
| Interquartile 25% (IQ1) | 6.3% | 4.7% |
| Interquartile 75% (IQ3) | 14.1% | 8.7% |
| Interquartile Range (IQR) | 7.8% | 4.0% |
| Standard Deviation (Sample) | 4.4% | 4.1% |
| Standard Deviation (Population) | 4.2% | 4.1% |
Similar Demographics by 4 or more Vehicles in Household
Demographics Similar to Marshallese by 4 or more Vehicles in Household
In terms of 4 or more vehicles in household, the demographic groups most similar to Marshallese are Yaqui (8.1%, a difference of 0.29%), Native/Alaskan (8.2%, a difference of 0.53%), Alaskan Athabascan (8.1%, a difference of 0.89%), Navajo (8.2%, a difference of 0.94%), and Immigrants from South Eastern Asia (8.2%, a difference of 0.97%).
| Demographics | Rating | Rank | 4 or more Vehicles in Household |
| Basques | 100.0 /100 | #25 | Exceptional 8.4% |
| Mexican American Indians | 100.0 /100 | #26 | Exceptional 8.4% |
| Sri Lankans | 100.0 /100 | #27 | Exceptional 8.4% |
| Cheyenne | 100.0 /100 | #28 | Exceptional 8.3% |
| Immigrants | South Eastern Asia | 100.0 /100 | #29 | Exceptional 8.2% |
| Navajo | 100.0 /100 | #30 | Exceptional 8.2% |
| Natives/Alaskans | 100.0 /100 | #31 | Exceptional 8.2% |
| Marshallese | 100.0 /100 | #32 | Exceptional 8.1% |
| Yaqui | 100.0 /100 | #33 | Exceptional 8.1% |
| Alaskan Athabascans | 100.0 /100 | #34 | Exceptional 8.1% |
| Guamanians/Chamorros | 100.0 /100 | #35 | Exceptional 8.1% |
| Norwegians | 100.0 /100 | #36 | Exceptional 8.0% |
| Scandinavians | 100.0 /100 | #37 | Exceptional 8.0% |
| Sioux | 100.0 /100 | #38 | Exceptional 8.0% |
| Spanish Americans | 100.0 /100 | #39 | Exceptional 8.0% |
Demographics Similar to Sierra Leoneans by 4 or more Vehicles in Household
In terms of 4 or more vehicles in household, the demographic groups most similar to Sierra Leoneans are Immigrants from Argentina (5.9%, a difference of 0.010%), Immigrants from Switzerland (5.9%, a difference of 0.20%), Immigrants from Malaysia (5.9%, a difference of 0.31%), Eastern European (5.9%, a difference of 0.38%), and Immigrants from Uganda (5.9%, a difference of 0.66%).
| Demographics | Rating | Rank | 4 or more Vehicles in Household |
| Immigrants | Singapore | 7.9 /100 | #226 | Tragic 5.9% |
| Immigrants | Western Asia | 7.8 /100 | #227 | Tragic 5.9% |
| Immigrants | Uganda | 7.5 /100 | #228 | Tragic 5.9% |
| Eastern Europeans | 6.8 /100 | #229 | Tragic 5.9% |
| Immigrants | Malaysia | 6.7 /100 | #230 | Tragic 5.9% |
| Immigrants | Switzerland | 6.4 /100 | #231 | Tragic 5.9% |
| Immigrants | Argentina | 6.0 /100 | #232 | Tragic 5.9% |
| Sierra Leoneans | 6.0 /100 | #233 | Tragic 5.9% |
| Africans | 4.6 /100 | #234 | Tragic 5.8% |
| Immigrants | Hungary | 4.6 /100 | #235 | Tragic 5.8% |
| Immigrants | Eritrea | 4.5 /100 | #236 | Tragic 5.8% |
| Turks | 4.1 /100 | #237 | Tragic 5.8% |
| Immigrants | Belgium | 4.0 /100 | #238 | Tragic 5.8% |
| Immigrants | Australia | 3.8 /100 | #239 | Tragic 5.8% |
| Immigrants | Poland | 3.8 /100 | #240 | Tragic 5.8% |