Marshallese vs Sierra Leonean Householder Income Over 65 years
COMPARE
Marshallese
Sierra Leonean
Householder Income Over 65 years
Householder Income Over 65 years Comparison
Marshallese
Sierra Leoneans
$65,874
HOUSEHOLDER INCOME OVER 65 YEARS
99.4/ 100
METRIC RATING
63rd/ 347
METRIC RANK
$65,038
HOUSEHOLDER INCOME OVER 65 YEARS
98.6/ 100
METRIC RATING
75th/ 347
METRIC RANK
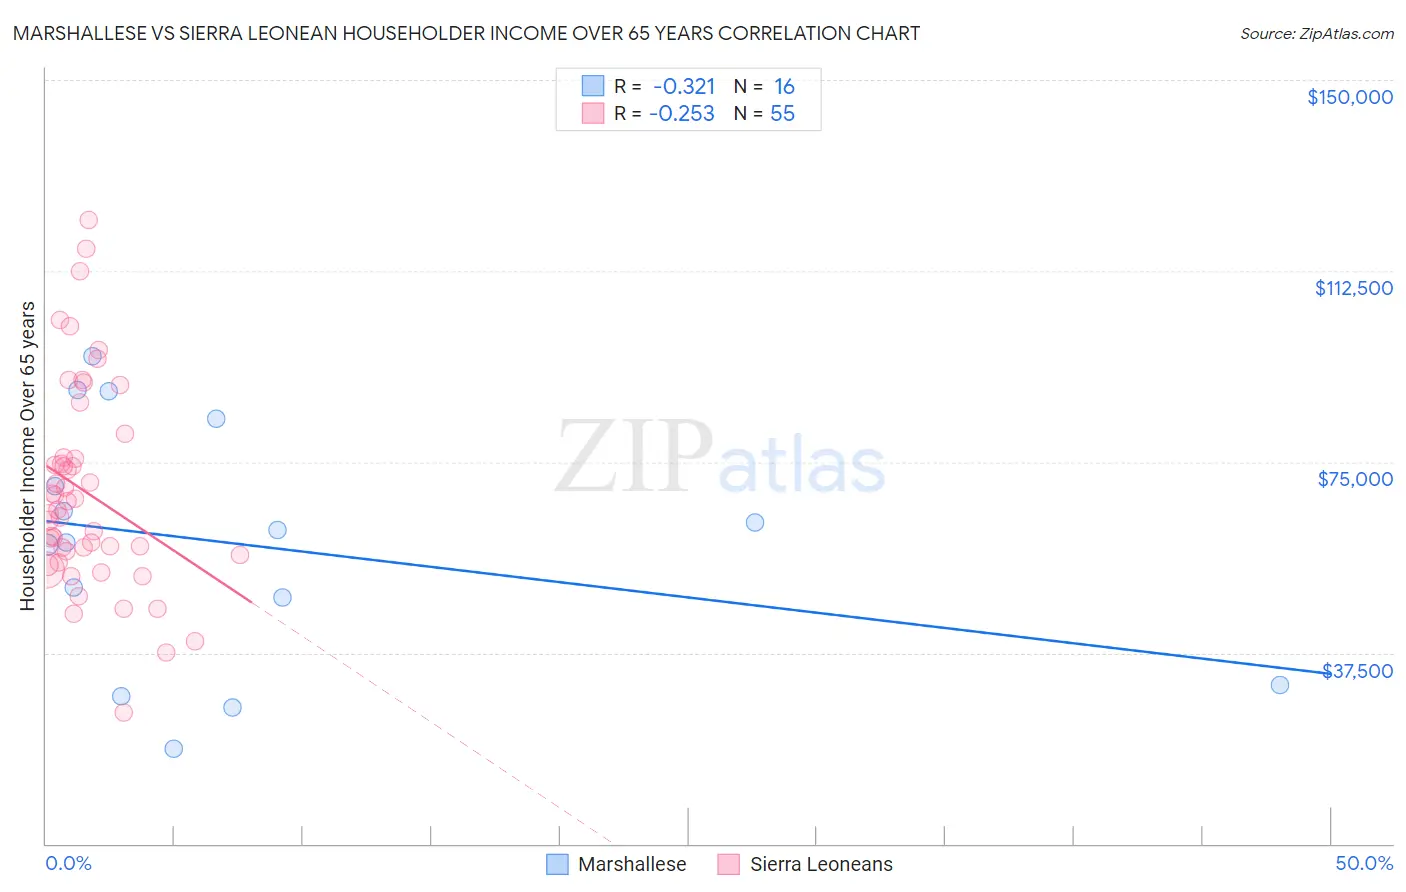
Marshallese vs Sierra Leonean Householder Income Over 65 years Correlation Chart
The statistical analysis conducted on geographies consisting of 14,755,394 people shows a mild negative correlation between the proportion of Marshallese and household income with householder over the age of 65 in the United States with a correlation coefficient (R) of -0.321 and weighted average of $65,874. Similarly, the statistical analysis conducted on geographies consisting of 83,245,915 people shows a weak negative correlation between the proportion of Sierra Leoneans and household income with householder over the age of 65 in the United States with a correlation coefficient (R) of -0.253 and weighted average of $65,038, a difference of 1.3%.
Householder Income Over 65 years Correlation Summary
| Measurement | Marshallese | Sierra Leonean |
| Minimum | $18,720 | $25,884 |
| Maximum | $95,763 | $122,529 |
| Range | $77,043 | $96,645 |
| Mean | $58,723 | $69,137 |
| Median | $60,305 | $65,524 |
| Interquartile 25% (IQ1) | $39,754 | $56,799 |
| Interquartile 75% (IQ3) | $76,864 | $75,960 |
| Interquartile Range (IQR) | $37,109 | $19,161 |
| Standard Deviation (Sample) | $23,740 | $20,039 |
| Standard Deviation (Population) | $22,986 | $19,856 |
Demographics Similar to Marshallese and Sierra Leoneans by Householder Income Over 65 years
In terms of householder income over 65 years, the demographic groups most similar to Marshallese are Zimbabwean ($65,854, a difference of 0.030%), Immigrants from Sierra Leone ($66,009, a difference of 0.21%), Maltese ($66,027, a difference of 0.23%), Immigrants from England ($65,715, a difference of 0.24%), and Immigrants from Lithuania ($66,087, a difference of 0.32%). Similarly, the demographic groups most similar to Sierra Leoneans are Ethiopian ($64,989, a difference of 0.080%), Immigrants from Canada ($64,952, a difference of 0.13%), Immigrants from Western Europe ($64,933, a difference of 0.16%), Hawaiian ($64,920, a difference of 0.18%), and Lithuanian ($65,209, a difference of 0.26%).
| Demographics | Rating | Rank | Householder Income Over 65 years |
| Immigrants | Norway | 99.5 /100 | #59 | Exceptional $66,118 |
| Immigrants | Lithuania | 99.5 /100 | #60 | Exceptional $66,087 |
| Maltese | 99.5 /100 | #61 | Exceptional $66,027 |
| Immigrants | Sierra Leone | 99.5 /100 | #62 | Exceptional $66,009 |
| Marshallese | 99.4 /100 | #63 | Exceptional $65,874 |
| Zimbabweans | 99.4 /100 | #64 | Exceptional $65,854 |
| Immigrants | England | 99.3 /100 | #65 | Exceptional $65,715 |
| South Africans | 99.3 /100 | #66 | Exceptional $65,652 |
| Immigrants | Malaysia | 99.1 /100 | #67 | Exceptional $65,497 |
| Egyptians | 99.1 /100 | #68 | Exceptional $65,441 |
| Samoans | 99.1 /100 | #69 | Exceptional $65,427 |
| Mongolians | 99.0 /100 | #70 | Exceptional $65,326 |
| Greeks | 98.9 /100 | #71 | Exceptional $65,306 |
| Argentineans | 98.9 /100 | #72 | Exceptional $65,246 |
| Immigrants | Ethiopia | 98.9 /100 | #73 | Exceptional $65,238 |
| Lithuanians | 98.8 /100 | #74 | Exceptional $65,209 |
| Sierra Leoneans | 98.6 /100 | #75 | Exceptional $65,038 |
| Ethiopians | 98.5 /100 | #76 | Exceptional $64,989 |
| Immigrants | Canada | 98.5 /100 | #77 | Exceptional $64,952 |
| Immigrants | Western Europe | 98.5 /100 | #78 | Exceptional $64,933 |
| Hawaiians | 98.4 /100 | #79 | Exceptional $64,920 |