Lithuanian vs Eastern European No Vehicles in Household
COMPARE
Lithuanian
Eastern European
No Vehicles in Household
No Vehicles in Household Comparison
Lithuanians
Eastern Europeans
8.4%
NO VEHICLES IN HOUSEHOLD
99.6/ 100
METRIC RATING
72nd/ 347
METRIC RANK
11.7%
NO VEHICLES IN HOUSEHOLD
2.7/ 100
METRIC RATING
241st/ 347
METRIC RANK
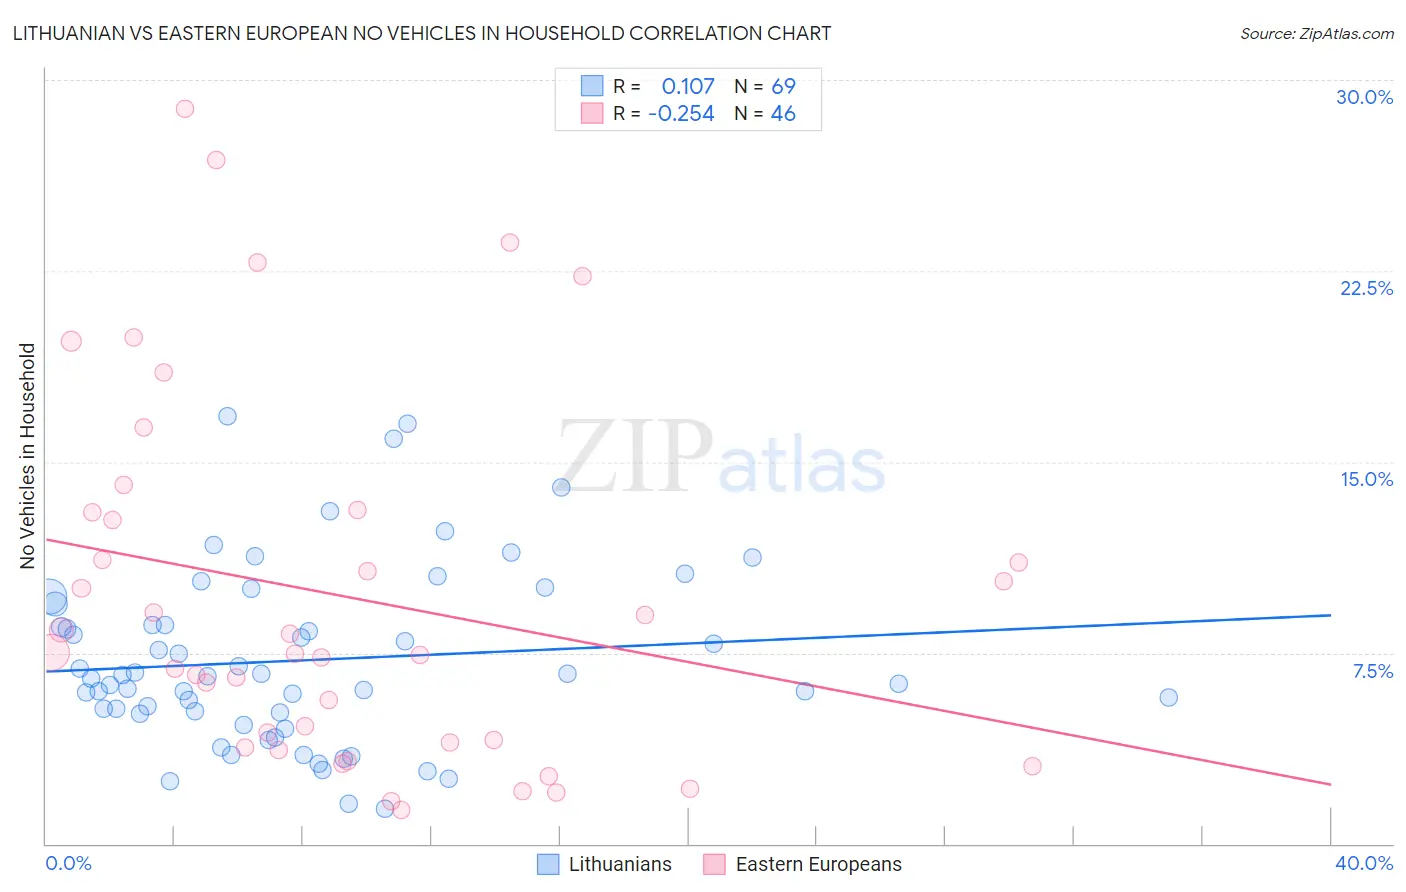
Lithuanian vs Eastern European No Vehicles in Household Correlation Chart
The statistical analysis conducted on geographies consisting of 420,405,245 people shows a poor positive correlation between the proportion of Lithuanians and percentage of households with no vehicle available in the United States with a correlation coefficient (R) of 0.107 and weighted average of 8.4%. Similarly, the statistical analysis conducted on geographies consisting of 459,145,536 people shows a weak negative correlation between the proportion of Eastern Europeans and percentage of households with no vehicle available in the United States with a correlation coefficient (R) of -0.254 and weighted average of 11.7%, a difference of 38.3%.
No Vehicles in Household Correlation Summary
| Measurement | Lithuanian | Eastern European |
| Minimum | 1.4% | 1.3% |
| Maximum | 16.8% | 28.9% |
| Range | 15.5% | 27.6% |
| Mean | 7.2% | 9.7% |
| Median | 6.6% | 7.5% |
| Interquartile 25% (IQ1) | 5.1% | 4.0% |
| Interquartile 75% (IQ3) | 9.0% | 13.0% |
| Interquartile Range (IQR) | 3.9% | 9.0% |
| Standard Deviation (Sample) | 3.5% | 7.2% |
| Standard Deviation (Population) | 3.4% | 7.1% |
Similar Demographics by No Vehicles in Household
Demographics Similar to Lithuanians by No Vehicles in Household
In terms of no vehicles in household, the demographic groups most similar to Lithuanians are Immigrants from Lebanon (8.4%, a difference of 0.030%), Polish (8.4%, a difference of 0.030%), Cajun (8.4%, a difference of 0.060%), Spaniard (8.4%, a difference of 0.78%), and Immigrants from Iran (8.4%, a difference of 0.84%).
| Demographics | Rating | Rank | No Vehicles in Household |
| Canadians | 99.7 /100 | #65 | Exceptional 8.3% |
| Palestinians | 99.7 /100 | #66 | Exceptional 8.3% |
| Immigrants | Scotland | 99.7 /100 | #67 | Exceptional 8.3% |
| Immigrants | Iran | 99.7 /100 | #68 | Exceptional 8.4% |
| Spaniards | 99.7 /100 | #69 | Exceptional 8.4% |
| Cajuns | 99.6 /100 | #70 | Exceptional 8.4% |
| Immigrants | Lebanon | 99.6 /100 | #71 | Exceptional 8.4% |
| Lithuanians | 99.6 /100 | #72 | Exceptional 8.4% |
| Poles | 99.6 /100 | #73 | Exceptional 8.4% |
| Cubans | 99.5 /100 | #74 | Exceptional 8.5% |
| Jordanians | 99.5 /100 | #75 | Exceptional 8.5% |
| Immigrants | Philippines | 99.5 /100 | #76 | Exceptional 8.5% |
| Iranians | 99.5 /100 | #77 | Exceptional 8.6% |
| Immigrants | South Central Asia | 99.5 /100 | #78 | Exceptional 8.6% |
| Portuguese | 99.5 /100 | #79 | Exceptional 8.6% |
Demographics Similar to Eastern Europeans by No Vehicles in Household
In terms of no vehicles in household, the demographic groups most similar to Eastern Europeans are Immigrants (11.7%, a difference of 0.010%), Taiwanese (11.7%, a difference of 0.070%), Turkish (11.7%, a difference of 0.11%), Cheyenne (11.7%, a difference of 0.44%), and Russian (11.6%, a difference of 0.53%).
| Demographics | Rating | Rank | No Vehicles in Household |
| Immigrants | Peru | 4.5 /100 | #234 | Tragic 11.5% |
| Kiowa | 4.0 /100 | #235 | Tragic 11.5% |
| Cree | 3.5 /100 | #236 | Tragic 11.6% |
| Ute | 3.3 /100 | #237 | Tragic 11.6% |
| Russians | 3.2 /100 | #238 | Tragic 11.6% |
| Taiwanese | 2.8 /100 | #239 | Tragic 11.7% |
| Immigrants | Immigrants | 2.7 /100 | #240 | Tragic 11.7% |
| Eastern Europeans | 2.7 /100 | #241 | Tragic 11.7% |
| Turks | 2.6 /100 | #242 | Tragic 11.7% |
| Cheyenne | 2.4 /100 | #243 | Tragic 11.7% |
| Immigrants | Portugal | 2.2 /100 | #244 | Tragic 11.7% |
| Immigrants | Honduras | 2.1 /100 | #245 | Tragic 11.8% |
| Menominee | 2.0 /100 | #246 | Tragic 11.8% |
| Immigrants | Czechoslovakia | 2.0 /100 | #247 | Tragic 11.8% |
| Immigrants | Belgium | 1.9 /100 | #248 | Tragic 11.8% |