Liberian vs Immigrants from South Africa 4 or more Vehicles in Household
COMPARE
Liberian
Immigrants from South Africa
4 or more Vehicles in Household
4 or more Vehicles in Household Comparison
Liberians
Immigrants from South Africa
5.3%
4 OR MORE VEHICLES IN HOUSEHOLD
0.1/ 100
METRIC RATING
292nd/ 347
METRIC RANK
6.2%
4 OR MORE VEHICLES IN HOUSEHOLD
35.4/ 100
METRIC RATING
187th/ 347
METRIC RANK
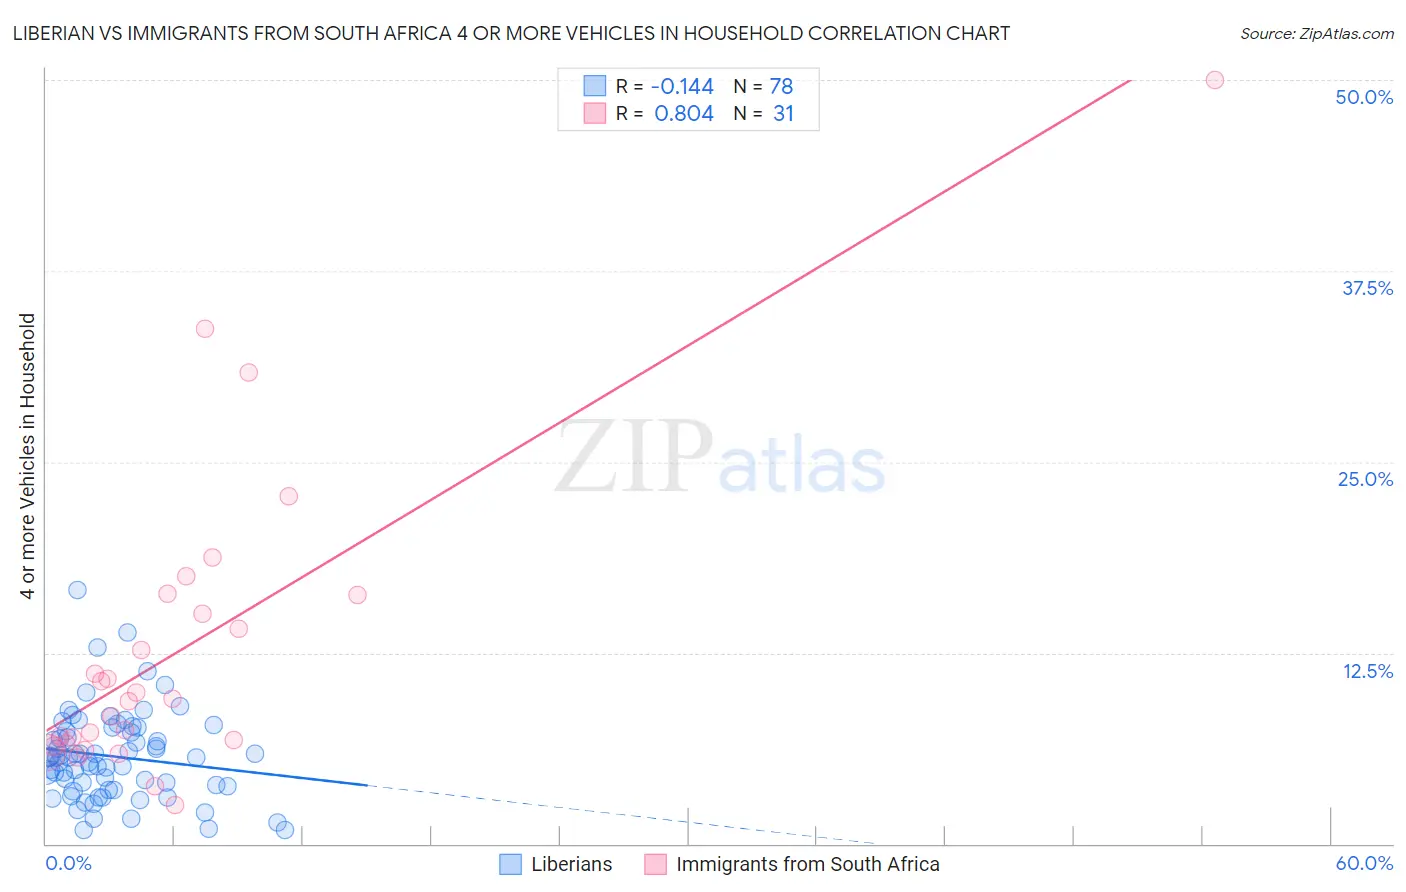
Liberian vs Immigrants from South Africa 4 or more Vehicles in Household Correlation Chart
The statistical analysis conducted on geographies consisting of 117,822,398 people shows a poor negative correlation between the proportion of Liberians and percentage of households with 4 or more vehicles available in the United States with a correlation coefficient (R) of -0.144 and weighted average of 5.3%. Similarly, the statistical analysis conducted on geographies consisting of 232,301,901 people shows a very strong positive correlation between the proportion of Immigrants from South Africa and percentage of households with 4 or more vehicles available in the United States with a correlation coefficient (R) of 0.804 and weighted average of 6.2%, a difference of 18.6%.
4 or more Vehicles in Household Correlation Summary
| Measurement | Liberian | Immigrants from South Africa |
| Minimum | 0.87% | 2.6% |
| Maximum | 16.6% | 50.0% |
| Range | 15.8% | 47.4% |
| Mean | 5.7% | 12.8% |
| Median | 5.6% | 9.5% |
| Interquartile 25% (IQ1) | 3.7% | 6.6% |
| Interquartile 75% (IQ3) | 7.3% | 16.3% |
| Interquartile Range (IQR) | 3.6% | 9.7% |
| Standard Deviation (Sample) | 2.9% | 10.0% |
| Standard Deviation (Population) | 2.9% | 9.9% |
Similar Demographics by 4 or more Vehicles in Household
Demographics Similar to Liberians by 4 or more Vehicles in Household
In terms of 4 or more vehicles in household, the demographic groups most similar to Liberians are Immigrants from Congo (5.2%, a difference of 0.030%), Ghanaian (5.2%, a difference of 0.090%), Immigrants from Bahamas (5.3%, a difference of 0.10%), Immigrants from Brazil (5.2%, a difference of 0.20%), and Israeli (5.2%, a difference of 0.38%).
| Demographics | Rating | Rank | 4 or more Vehicles in Household |
| Immigrants | Liberia | 0.2 /100 | #285 | Tragic 5.4% |
| Immigrants | Colombia | 0.2 /100 | #286 | Tragic 5.4% |
| Immigrants | Croatia | 0.2 /100 | #287 | Tragic 5.4% |
| Venezuelans | 0.2 /100 | #288 | Tragic 5.3% |
| Immigrants | Bosnia and Herzegovina | 0.2 /100 | #289 | Tragic 5.3% |
| Immigrants | Russia | 0.2 /100 | #290 | Tragic 5.3% |
| Immigrants | Bahamas | 0.1 /100 | #291 | Tragic 5.3% |
| Liberians | 0.1 /100 | #292 | Tragic 5.3% |
| Immigrants | Congo | 0.1 /100 | #293 | Tragic 5.2% |
| Ghanaians | 0.1 /100 | #294 | Tragic 5.2% |
| Immigrants | Brazil | 0.1 /100 | #295 | Tragic 5.2% |
| Israelis | 0.1 /100 | #296 | Tragic 5.2% |
| Immigrants | Venezuela | 0.1 /100 | #297 | Tragic 5.2% |
| Immigrants | South America | 0.1 /100 | #298 | Tragic 5.2% |
| Immigrants | Ghana | 0.1 /100 | #299 | Tragic 5.2% |
Demographics Similar to Immigrants from South Africa by 4 or more Vehicles in Household
In terms of 4 or more vehicles in household, the demographic groups most similar to Immigrants from South Africa are Kiowa (6.2%, a difference of 0.070%), Immigrants from Northern Europe (6.2%, a difference of 0.15%), Thai (6.2%, a difference of 0.17%), Iraqi (6.2%, a difference of 0.21%), and Immigrants from Burma/Myanmar (6.2%, a difference of 0.23%).
| Demographics | Rating | Rank | 4 or more Vehicles in Household |
| Syrians | 42.0 /100 | #180 | Average 6.3% |
| Yugoslavians | 41.1 /100 | #181 | Average 6.3% |
| South American Indians | 40.7 /100 | #182 | Average 6.3% |
| Immigrants | Burma/Myanmar | 37.5 /100 | #183 | Fair 6.2% |
| Iraqis | 37.3 /100 | #184 | Fair 6.2% |
| Thais | 36.9 /100 | #185 | Fair 6.2% |
| Immigrants | Northern Europe | 36.8 /100 | #186 | Fair 6.2% |
| Immigrants | South Africa | 35.4 /100 | #187 | Fair 6.2% |
| Kiowa | 34.7 /100 | #188 | Fair 6.2% |
| Immigrants | Eastern Asia | 33.3 /100 | #189 | Fair 6.2% |
| South Africans | 32.2 /100 | #190 | Fair 6.2% |
| Inupiat | 30.7 /100 | #191 | Fair 6.2% |
| Romanians | 30.7 /100 | #192 | Fair 6.2% |
| Immigrants | Kuwait | 28.0 /100 | #193 | Fair 6.2% |
| Immigrants | Sweden | 27.0 /100 | #194 | Fair 6.2% |