Immigrants from Romania vs Immigrants from South Africa 4 or more Vehicles in Household
COMPARE
Immigrants from Romania
Immigrants from South Africa
4 or more Vehicles in Household
4 or more Vehicles in Household Comparison
Immigrants from Romania
Immigrants from South Africa
6.0%
4 OR MORE VEHICLES IN HOUSEHOLD
13.8/ 100
METRIC RATING
216th/ 347
METRIC RANK
6.2%
4 OR MORE VEHICLES IN HOUSEHOLD
35.4/ 100
METRIC RATING
187th/ 347
METRIC RANK
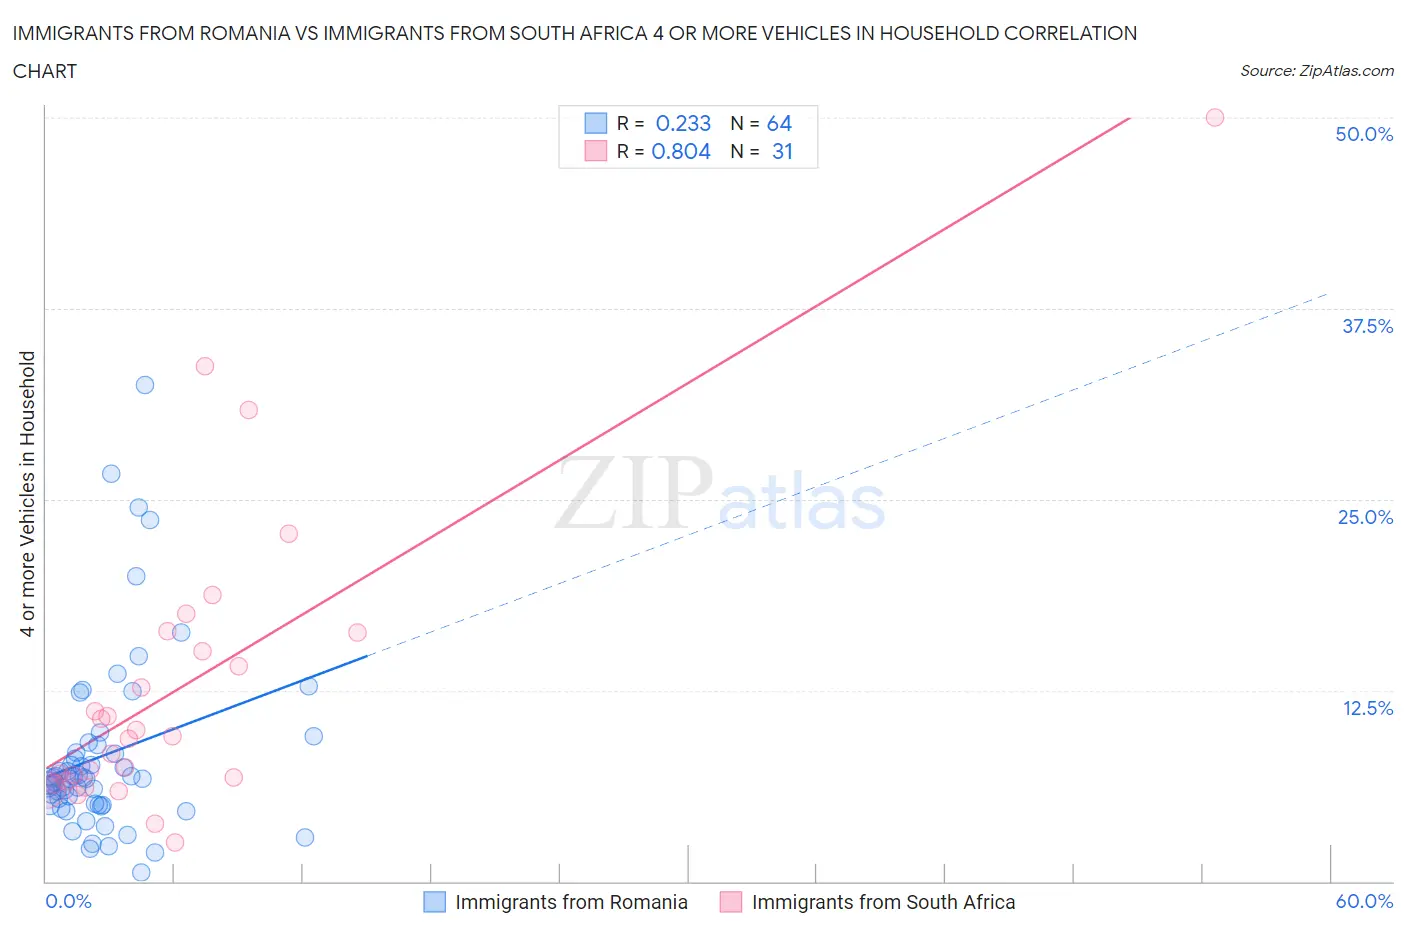
Immigrants from Romania vs Immigrants from South Africa 4 or more Vehicles in Household Correlation Chart
The statistical analysis conducted on geographies consisting of 256,113,445 people shows a weak positive correlation between the proportion of Immigrants from Romania and percentage of households with 4 or more vehicles available in the United States with a correlation coefficient (R) of 0.233 and weighted average of 6.0%. Similarly, the statistical analysis conducted on geographies consisting of 232,301,901 people shows a very strong positive correlation between the proportion of Immigrants from South Africa and percentage of households with 4 or more vehicles available in the United States with a correlation coefficient (R) of 0.804 and weighted average of 6.2%, a difference of 3.3%.
4 or more Vehicles in Household Correlation Summary
| Measurement | Immigrants from Romania | Immigrants from South Africa |
| Minimum | 0.55% | 2.6% |
| Maximum | 32.5% | 50.0% |
| Range | 31.9% | 47.4% |
| Mean | 8.2% | 12.8% |
| Median | 6.7% | 9.5% |
| Interquartile 25% (IQ1) | 5.0% | 6.6% |
| Interquartile 75% (IQ3) | 8.7% | 16.3% |
| Interquartile Range (IQR) | 3.6% | 9.7% |
| Standard Deviation (Sample) | 6.0% | 10.0% |
| Standard Deviation (Population) | 6.0% | 9.9% |
Similar Demographics by 4 or more Vehicles in Household
Demographics Similar to Immigrants from Romania by 4 or more Vehicles in Household
In terms of 4 or more vehicles in household, the demographic groups most similar to Immigrants from Romania are Immigrants from China (6.0%, a difference of 0.0%), Immigrants from Austria (6.0%, a difference of 0.11%), Arab (6.0%, a difference of 0.13%), Immigrants from Egypt (6.0%, a difference of 0.19%), and Panamanian (6.0%, a difference of 0.20%).
| Demographics | Rating | Rank | 4 or more Vehicles in Household |
| Immigrants | Honduras | 15.4 /100 | #209 | Poor 6.1% |
| Immigrants | Zimbabwe | 15.1 /100 | #210 | Poor 6.0% |
| Panamanians | 14.8 /100 | #211 | Poor 6.0% |
| Immigrants | Egypt | 14.7 /100 | #212 | Poor 6.0% |
| Arabs | 14.4 /100 | #213 | Poor 6.0% |
| Immigrants | Austria | 14.3 /100 | #214 | Poor 6.0% |
| Immigrants | China | 13.8 /100 | #215 | Poor 6.0% |
| Immigrants | Romania | 13.8 /100 | #216 | Poor 6.0% |
| Nigerians | 12.2 /100 | #217 | Poor 6.0% |
| Immigrants | Italy | 11.0 /100 | #218 | Poor 6.0% |
| Serbians | 11.0 /100 | #219 | Poor 6.0% |
| Russians | 10.3 /100 | #220 | Poor 6.0% |
| Immigrants | Moldova | 9.3 /100 | #221 | Tragic 6.0% |
| Cajuns | 9.2 /100 | #222 | Tragic 6.0% |
| Immigrants | Kenya | 9.2 /100 | #223 | Tragic 6.0% |
Demographics Similar to Immigrants from South Africa by 4 or more Vehicles in Household
In terms of 4 or more vehicles in household, the demographic groups most similar to Immigrants from South Africa are Kiowa (6.2%, a difference of 0.070%), Immigrants from Northern Europe (6.2%, a difference of 0.15%), Thai (6.2%, a difference of 0.17%), Iraqi (6.2%, a difference of 0.21%), and Immigrants from Burma/Myanmar (6.2%, a difference of 0.23%).
| Demographics | Rating | Rank | 4 or more Vehicles in Household |
| Syrians | 42.0 /100 | #180 | Average 6.3% |
| Yugoslavians | 41.1 /100 | #181 | Average 6.3% |
| South American Indians | 40.7 /100 | #182 | Average 6.3% |
| Immigrants | Burma/Myanmar | 37.5 /100 | #183 | Fair 6.2% |
| Iraqis | 37.3 /100 | #184 | Fair 6.2% |
| Thais | 36.9 /100 | #185 | Fair 6.2% |
| Immigrants | Northern Europe | 36.8 /100 | #186 | Fair 6.2% |
| Immigrants | South Africa | 35.4 /100 | #187 | Fair 6.2% |
| Kiowa | 34.7 /100 | #188 | Fair 6.2% |
| Immigrants | Eastern Asia | 33.3 /100 | #189 | Fair 6.2% |
| South Africans | 32.2 /100 | #190 | Fair 6.2% |
| Inupiat | 30.7 /100 | #191 | Fair 6.2% |
| Romanians | 30.7 /100 | #192 | Fair 6.2% |
| Immigrants | Kuwait | 28.0 /100 | #193 | Fair 6.2% |
| Immigrants | Sweden | 27.0 /100 | #194 | Fair 6.2% |