Liberian vs Immigrants from South Africa In Labor Force | Age 35-44
COMPARE
Liberian
Immigrants from South Africa
In Labor Force | Age 35-44
In Labor Force | Age 35-44 Comparison
Liberians
Immigrants from South Africa
85.7%
IN LABOR FORCE | AGE 35-44
100.0/ 100
METRIC RATING
12th/ 347
METRIC RANK
84.3%
IN LABOR FORCE | AGE 35-44
42.8/ 100
METRIC RATING
179th/ 347
METRIC RANK
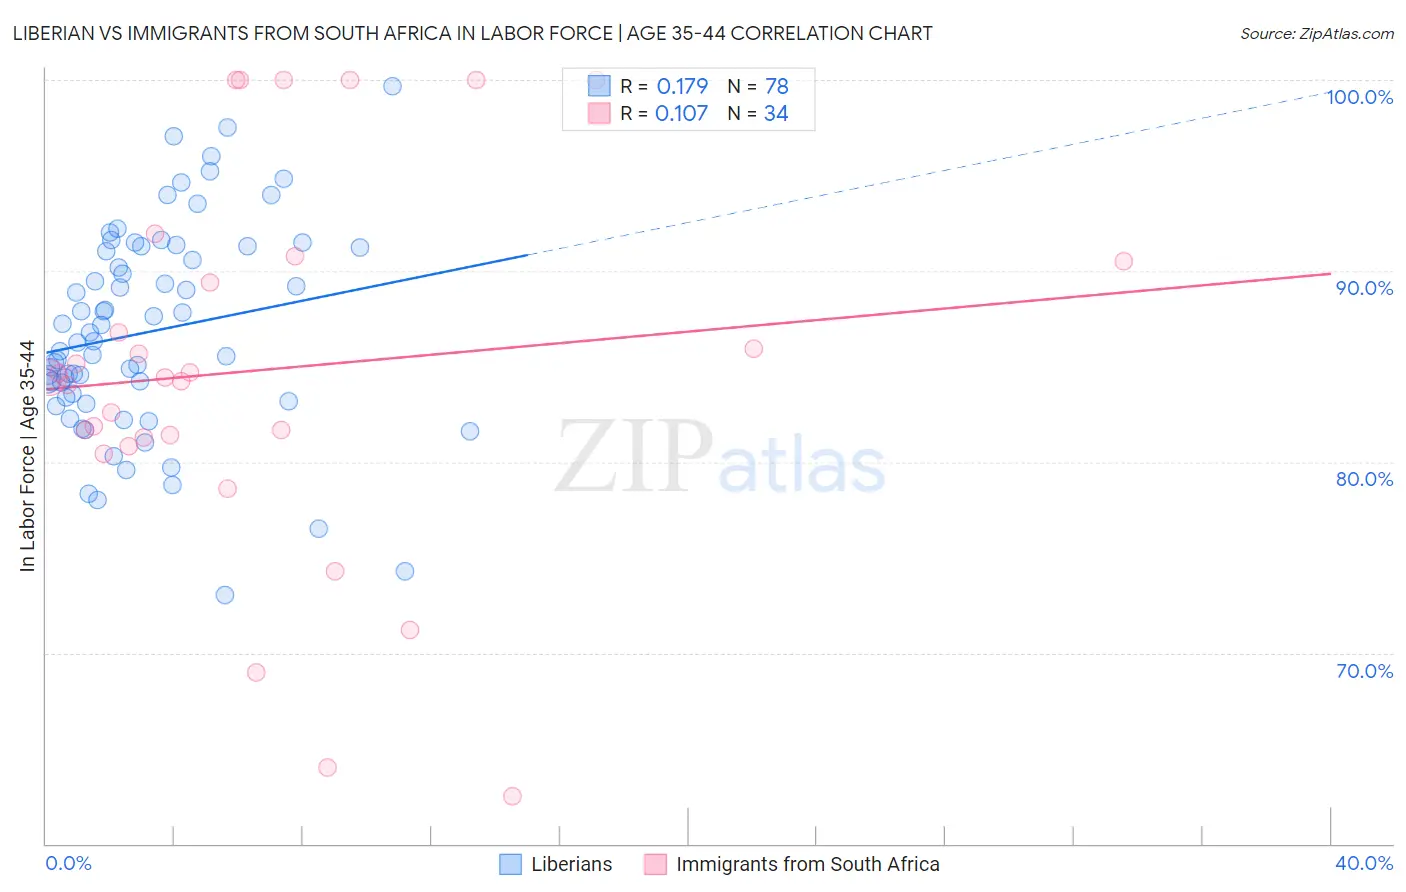
Liberian vs Immigrants from South Africa In Labor Force | Age 35-44 Correlation Chart
The statistical analysis conducted on geographies consisting of 118,044,655 people shows a poor positive correlation between the proportion of Liberians and labor force participation rate among population between the ages 35 and 44 in the United States with a correlation coefficient (R) of 0.179 and weighted average of 85.7%. Similarly, the statistical analysis conducted on geographies consisting of 233,278,888 people shows a poor positive correlation between the proportion of Immigrants from South Africa and labor force participation rate among population between the ages 35 and 44 in the United States with a correlation coefficient (R) of 0.107 and weighted average of 84.3%, a difference of 1.6%.
In Labor Force | Age 35-44 Correlation Summary
| Measurement | Liberian | Immigrants from South Africa |
| Minimum | 73.0% | 62.5% |
| Maximum | 99.7% | 100.0% |
| Range | 26.7% | 37.5% |
| Mean | 86.8% | 84.8% |
| Median | 86.3% | 84.4% |
| Interquartile 25% (IQ1) | 83.4% | 81.3% |
| Interquartile 75% (IQ3) | 91.2% | 90.5% |
| Interquartile Range (IQR) | 7.8% | 9.2% |
| Standard Deviation (Sample) | 5.4% | 9.8% |
| Standard Deviation (Population) | 5.4% | 9.6% |
Similar Demographics by In Labor Force | Age 35-44
Demographics Similar to Liberians by In Labor Force | Age 35-44
In terms of in labor force | age 35-44, the demographic groups most similar to Liberians are Somali (85.6%, a difference of 0.020%), Immigrants from Somalia (85.6%, a difference of 0.020%), Norwegian (85.6%, a difference of 0.060%), Immigrants from Ireland (85.6%, a difference of 0.060%), and Immigrants from North Macedonia (85.6%, a difference of 0.11%).
| Demographics | Rating | Rank | In Labor Force | Age 35-44 |
| Zimbabweans | 100.0 /100 | #5 | Exceptional 86.1% |
| Bolivians | 100.0 /100 | #6 | Exceptional 86.1% |
| Immigrants | Sierra Leone | 100.0 /100 | #7 | Exceptional 86.1% |
| Immigrants | Ethiopia | 100.0 /100 | #8 | Exceptional 85.9% |
| Ethiopians | 100.0 /100 | #9 | Exceptional 85.9% |
| Cape Verdeans | 100.0 /100 | #10 | Exceptional 85.8% |
| Immigrants | Cameroon | 100.0 /100 | #11 | Exceptional 85.8% |
| Liberians | 100.0 /100 | #12 | Exceptional 85.7% |
| Somalis | 100.0 /100 | #13 | Exceptional 85.6% |
| Immigrants | Somalia | 100.0 /100 | #14 | Exceptional 85.6% |
| Norwegians | 100.0 /100 | #15 | Exceptional 85.6% |
| Immigrants | Ireland | 100.0 /100 | #16 | Exceptional 85.6% |
| Immigrants | North Macedonia | 100.0 /100 | #17 | Exceptional 85.6% |
| Carpatho Rusyns | 100.0 /100 | #18 | Exceptional 85.6% |
| Slovenes | 100.0 /100 | #19 | Exceptional 85.6% |
Demographics Similar to Immigrants from South Africa by In Labor Force | Age 35-44
In terms of in labor force | age 35-44, the demographic groups most similar to Immigrants from South Africa are French Canadian (84.3%, a difference of 0.010%), Northern European (84.3%, a difference of 0.010%), Sri Lankan (84.4%, a difference of 0.030%), Danish (84.3%, a difference of 0.030%), and Pakistani (84.4%, a difference of 0.040%).
| Demographics | Rating | Rank | In Labor Force | Age 35-44 |
| Scandinavians | 51.2 /100 | #172 | Average 84.4% |
| Immigrants | Trinidad and Tobago | 50.7 /100 | #173 | Average 84.4% |
| Immigrants | Iran | 50.0 /100 | #174 | Average 84.4% |
| Pakistanis | 48.2 /100 | #175 | Average 84.4% |
| Sri Lankans | 47.3 /100 | #176 | Average 84.4% |
| French Canadians | 44.3 /100 | #177 | Average 84.3% |
| Northern Europeans | 44.1 /100 | #178 | Average 84.3% |
| Immigrants | South Africa | 42.8 /100 | #179 | Average 84.3% |
| Danes | 38.8 /100 | #180 | Fair 84.3% |
| Immigrants | West Indies | 36.4 /100 | #181 | Fair 84.3% |
| Koreans | 36.3 /100 | #182 | Fair 84.3% |
| Barbadians | 36.2 /100 | #183 | Fair 84.3% |
| Armenians | 35.6 /100 | #184 | Fair 84.3% |
| Costa Ricans | 35.3 /100 | #185 | Fair 84.3% |
| Australians | 35.1 /100 | #186 | Fair 84.3% |