Nepalese vs Czech 4 or more Vehicles in Household
COMPARE
Nepalese
Czech
4 or more Vehicles in Household
4 or more Vehicles in Household Comparison
Nepalese
Czechs
8.7%
4 OR MORE VEHICLES IN HOUSEHOLD
100.0/ 100
METRIC RATING
18th/ 347
METRIC RANK
7.4%
4 OR MORE VEHICLES IN HOUSEHOLD
99.8/ 100
METRIC RATING
79th/ 347
METRIC RANK
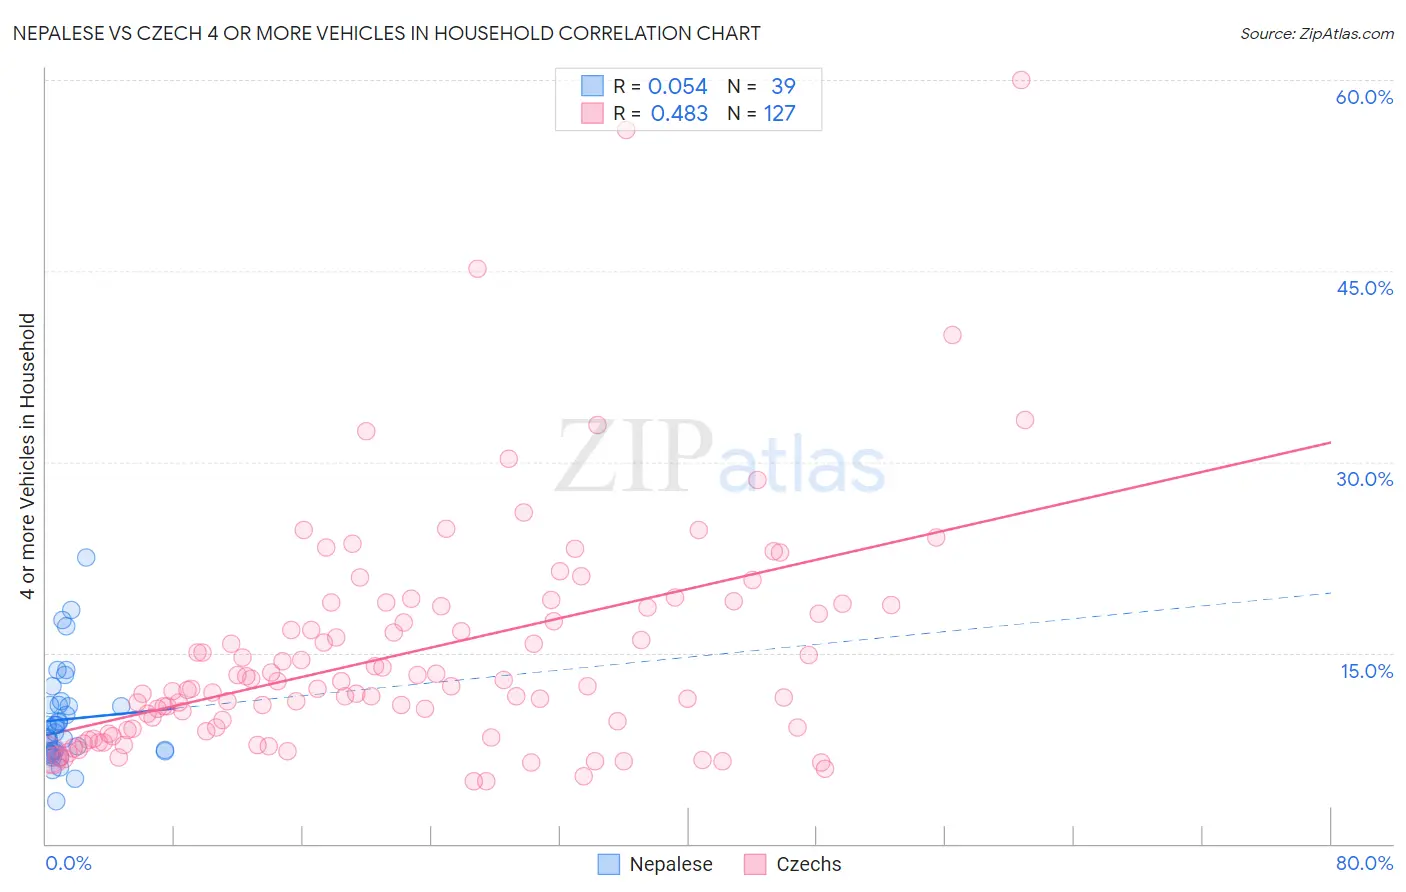
Nepalese vs Czech 4 or more Vehicles in Household Correlation Chart
The statistical analysis conducted on geographies consisting of 24,517,800 people shows a slight positive correlation between the proportion of Nepalese and percentage of households with 4 or more vehicles available in the United States with a correlation coefficient (R) of 0.054 and weighted average of 8.7%. Similarly, the statistical analysis conducted on geographies consisting of 482,666,265 people shows a moderate positive correlation between the proportion of Czechs and percentage of households with 4 or more vehicles available in the United States with a correlation coefficient (R) of 0.483 and weighted average of 7.4%, a difference of 19.0%.
4 or more Vehicles in Household Correlation Summary
| Measurement | Nepalese | Czech |
| Minimum | 3.4% | 4.9% |
| Maximum | 22.4% | 60.0% |
| Range | 19.1% | 55.1% |
| Mean | 9.8% | 14.9% |
| Median | 8.8% | 12.3% |
| Interquartile 25% (IQ1) | 7.2% | 8.9% |
| Interquartile 75% (IQ3) | 10.9% | 18.6% |
| Interquartile Range (IQR) | 3.7% | 9.8% |
| Standard Deviation (Sample) | 3.9% | 9.1% |
| Standard Deviation (Population) | 3.9% | 9.0% |
Similar Demographics by 4 or more Vehicles in Household
Demographics Similar to Nepalese by 4 or more Vehicles in Household
In terms of 4 or more vehicles in household, the demographic groups most similar to Nepalese are Ute (8.8%, a difference of 0.10%), Lumbee (8.8%, a difference of 0.43%), Shoshone (8.8%, a difference of 1.1%), Korean (8.6%, a difference of 1.1%), and Chinese (8.8%, a difference of 1.2%).
| Demographics | Rating | Rank | 4 or more Vehicles in Household |
| Immigrants | Mexico | 100.0 /100 | #11 | Exceptional 9.0% |
| Mexicans | 100.0 /100 | #12 | Exceptional 8.9% |
| Hawaiians | 100.0 /100 | #13 | Exceptional 8.9% |
| Chinese | 100.0 /100 | #14 | Exceptional 8.8% |
| Shoshone | 100.0 /100 | #15 | Exceptional 8.8% |
| Lumbee | 100.0 /100 | #16 | Exceptional 8.8% |
| Ute | 100.0 /100 | #17 | Exceptional 8.8% |
| Nepalese | 100.0 /100 | #18 | Exceptional 8.7% |
| Koreans | 100.0 /100 | #19 | Exceptional 8.6% |
| Pueblo | 100.0 /100 | #20 | Exceptional 8.6% |
| Danes | 100.0 /100 | #21 | Exceptional 8.6% |
| Immigrants | Vietnam | 100.0 /100 | #22 | Exceptional 8.6% |
| Immigrants | Philippines | 100.0 /100 | #23 | Exceptional 8.5% |
| Immigrants | Central America | 100.0 /100 | #24 | Exceptional 8.5% |
| Basques | 100.0 /100 | #25 | Exceptional 8.4% |
Demographics Similar to Czechs by 4 or more Vehicles in Household
In terms of 4 or more vehicles in household, the demographic groups most similar to Czechs are Alaska Native (7.3%, a difference of 0.14%), White/Caucasian (7.4%, a difference of 0.17%), Apache (7.4%, a difference of 0.24%), Laotian (7.4%, a difference of 0.41%), and Icelander (7.4%, a difference of 0.46%).
| Demographics | Rating | Rank | 4 or more Vehicles in Household |
| Scotch-Irish | 99.9 /100 | #72 | Exceptional 7.4% |
| Portuguese | 99.9 /100 | #73 | Exceptional 7.4% |
| Icelanders | 99.9 /100 | #74 | Exceptional 7.4% |
| Immigrants | Cambodia | 99.9 /100 | #75 | Exceptional 7.4% |
| Laotians | 99.9 /100 | #76 | Exceptional 7.4% |
| Apache | 99.9 /100 | #77 | Exceptional 7.4% |
| Whites/Caucasians | 99.8 /100 | #78 | Exceptional 7.4% |
| Czechs | 99.8 /100 | #79 | Exceptional 7.4% |
| Alaska Natives | 99.8 /100 | #80 | Exceptional 7.3% |
| Finns | 99.8 /100 | #81 | Exceptional 7.3% |
| Northern Europeans | 99.8 /100 | #82 | Exceptional 7.3% |
| Potawatomi | 99.7 /100 | #83 | Exceptional 7.3% |
| Afghans | 99.7 /100 | #84 | Exceptional 7.3% |
| Cree | 99.7 /100 | #85 | Exceptional 7.2% |
| Immigrants | Indonesia | 99.6 /100 | #86 | Exceptional 7.2% |