Laotian vs Immigrants from Vietnam No Vehicles in Household
COMPARE
Laotian
Immigrants from Vietnam
No Vehicles in Household
No Vehicles in Household Comparison
Laotians
Immigrants from Vietnam
9.1%
NO VEHICLES IN HOUSEHOLD
97.8/ 100
METRIC RATING
106th/ 347
METRIC RANK
7.7%
NO VEHICLES IN HOUSEHOLD
100.0/ 100
METRIC RATING
34th/ 347
METRIC RANK
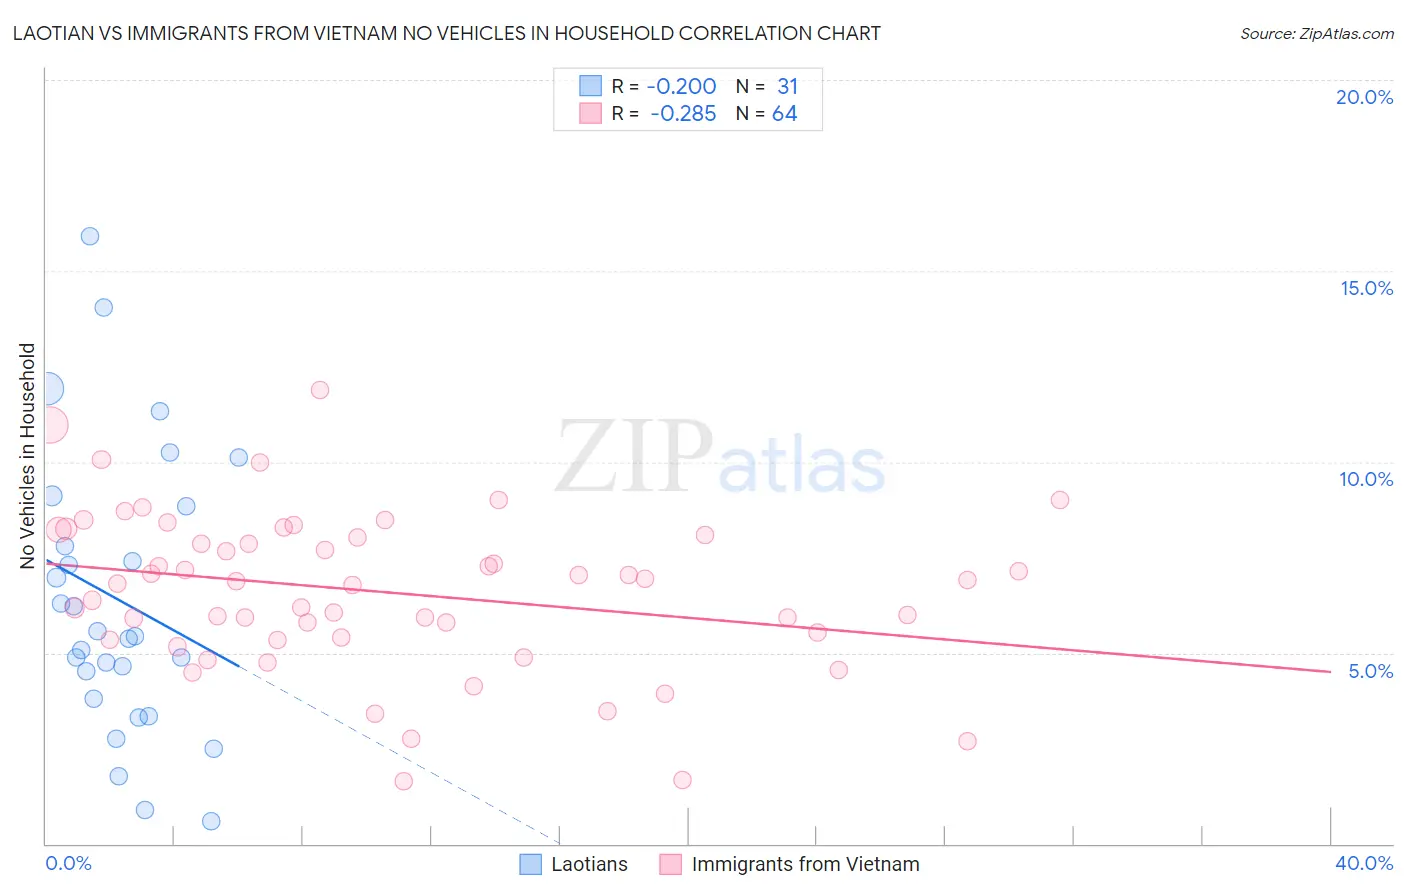
Laotian vs Immigrants from Vietnam No Vehicles in Household Correlation Chart
The statistical analysis conducted on geographies consisting of 224,346,725 people shows a poor negative correlation between the proportion of Laotians and percentage of households with no vehicle available in the United States with a correlation coefficient (R) of -0.200 and weighted average of 9.1%. Similarly, the statistical analysis conducted on geographies consisting of 403,819,008 people shows a weak negative correlation between the proportion of Immigrants from Vietnam and percentage of households with no vehicle available in the United States with a correlation coefficient (R) of -0.285 and weighted average of 7.7%, a difference of 17.3%.
No Vehicles in Household Correlation Summary
| Measurement | Laotian | Immigrants from Vietnam |
| Minimum | 0.59% | 1.6% |
| Maximum | 15.9% | 11.9% |
| Range | 15.3% | 10.2% |
| Mean | 6.4% | 6.6% |
| Median | 5.4% | 6.8% |
| Interquartile 25% (IQ1) | 3.8% | 5.4% |
| Interquartile 75% (IQ3) | 8.9% | 8.1% |
| Interquartile Range (IQR) | 5.0% | 2.7% |
| Standard Deviation (Sample) | 3.7% | 2.1% |
| Standard Deviation (Population) | 3.6% | 2.0% |
Similar Demographics by No Vehicles in Household
Demographics Similar to Laotians by No Vehicles in Household
In terms of no vehicles in household, the demographic groups most similar to Laotians are Spanish American (9.1%, a difference of 0.090%), Zimbabwean (9.0%, a difference of 0.25%), Hispanic or Latino (9.1%, a difference of 0.26%), Mexican American Indian (9.1%, a difference of 0.35%), and Maltese (9.1%, a difference of 0.48%).
| Demographics | Rating | Rank | No Vehicles in Household |
| Bulgarians | 98.4 /100 | #99 | Exceptional 9.0% |
| Asians | 98.3 /100 | #100 | Exceptional 9.0% |
| Pakistanis | 98.3 /100 | #101 | Exceptional 9.0% |
| Yugoslavians | 98.3 /100 | #102 | Exceptional 9.0% |
| Seminole | 98.3 /100 | #103 | Exceptional 9.0% |
| Zimbabweans | 98.0 /100 | #104 | Exceptional 9.0% |
| Spanish Americans | 97.9 /100 | #105 | Exceptional 9.1% |
| Laotians | 97.8 /100 | #106 | Exceptional 9.1% |
| Hispanics or Latinos | 97.7 /100 | #107 | Exceptional 9.1% |
| Mexican American Indians | 97.6 /100 | #108 | Exceptional 9.1% |
| Maltese | 97.6 /100 | #109 | Exceptional 9.1% |
| Delaware | 97.2 /100 | #110 | Exceptional 9.2% |
| Immigrants | Kuwait | 95.1 /100 | #111 | Exceptional 9.4% |
| Armenians | 95.0 /100 | #112 | Exceptional 9.4% |
| Immigrants | Netherlands | 94.8 /100 | #113 | Exceptional 9.4% |
Demographics Similar to Immigrants from Vietnam by No Vehicles in Household
In terms of no vehicles in household, the demographic groups most similar to Immigrants from Vietnam are Immigrants from Taiwan (7.7%, a difference of 0.13%), Cherokee (7.7%, a difference of 0.14%), Malaysian (7.7%, a difference of 0.24%), Iraqi (7.7%, a difference of 0.28%), and Native Hawaiian (7.7%, a difference of 0.49%).
| Demographics | Rating | Rank | No Vehicles in Household |
| British | 100.0 /100 | #27 | Exceptional 7.6% |
| Samoans | 100.0 /100 | #28 | Exceptional 7.6% |
| Americans | 100.0 /100 | #29 | Exceptional 7.7% |
| Finns | 100.0 /100 | #30 | Exceptional 7.7% |
| Native Hawaiians | 100.0 /100 | #31 | Exceptional 7.7% |
| Malaysians | 100.0 /100 | #32 | Exceptional 7.7% |
| Immigrants | Taiwan | 100.0 /100 | #33 | Exceptional 7.7% |
| Immigrants | Vietnam | 100.0 /100 | #34 | Exceptional 7.7% |
| Cherokee | 99.9 /100 | #35 | Exceptional 7.7% |
| Iraqis | 99.9 /100 | #36 | Exceptional 7.7% |
| Basques | 99.9 /100 | #37 | Exceptional 7.8% |
| Creek | 99.9 /100 | #38 | Exceptional 7.8% |
| Immigrants | Fiji | 99.9 /100 | #39 | Exceptional 7.8% |
| Czechoslovakians | 99.9 /100 | #40 | Exceptional 7.8% |
| French Canadians | 99.9 /100 | #41 | Exceptional 7.8% |