Spanish vs Palestinian No Vehicles in Household
COMPARE
Spanish
Palestinian
No Vehicles in Household
No Vehicles in Household Comparison
Spanish
Palestinians
7.9%
NO VEHICLES IN HOUSEHOLD
99.9/ 100
METRIC RATING
46th/ 347
METRIC RANK
8.3%
NO VEHICLES IN HOUSEHOLD
99.7/ 100
METRIC RATING
66th/ 347
METRIC RANK
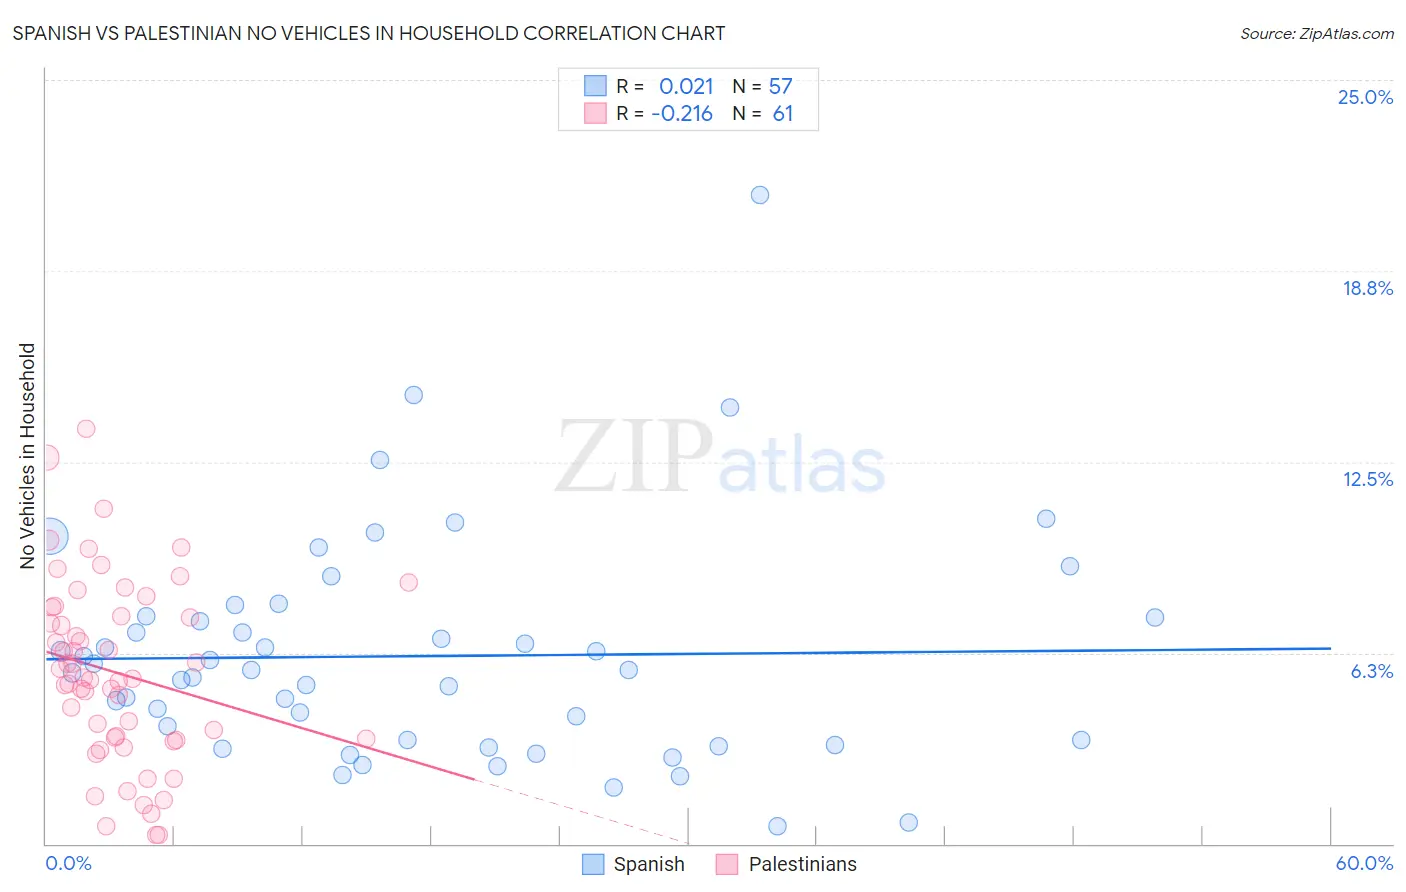
Spanish vs Palestinian No Vehicles in Household Correlation Chart
The statistical analysis conducted on geographies consisting of 420,840,266 people shows no correlation between the proportion of Spanish and percentage of households with no vehicle available in the United States with a correlation coefficient (R) of 0.021 and weighted average of 7.9%. Similarly, the statistical analysis conducted on geographies consisting of 216,223,800 people shows a weak negative correlation between the proportion of Palestinians and percentage of households with no vehicle available in the United States with a correlation coefficient (R) of -0.216 and weighted average of 8.3%, a difference of 5.2%.
No Vehicles in Household Correlation Summary
| Measurement | Spanish | Palestinian |
| Minimum | 0.56% | 0.29% |
| Maximum | 21.2% | 13.6% |
| Range | 20.7% | 13.3% |
| Mean | 6.1% | 5.6% |
| Median | 5.7% | 5.4% |
| Interquartile 25% (IQ1) | 3.3% | 3.4% |
| Interquartile 75% (IQ3) | 7.4% | 7.6% |
| Interquartile Range (IQR) | 4.1% | 4.2% |
| Standard Deviation (Sample) | 3.7% | 3.0% |
| Standard Deviation (Population) | 3.7% | 3.0% |
Demographics Similar to Spanish and Palestinians by No Vehicles in Household
In terms of no vehicles in household, the demographic groups most similar to Spanish are Northern European (7.9%, a difference of 0.12%), Afghan (8.0%, a difference of 0.59%), Guamanian/Chamorro (8.0%, a difference of 0.77%), Belgian (8.0%, a difference of 0.84%), and Korean (8.0%, a difference of 0.94%). Similarly, the demographic groups most similar to Palestinians are Canadian (8.3%, a difference of 0.11%), Croatian (8.3%, a difference of 0.86%), Slovak (8.3%, a difference of 0.95%), Chinese (8.2%, a difference of 1.3%), and Thai (8.2%, a difference of 1.8%).
| Demographics | Rating | Rank | No Vehicles in Household |
| Spanish | 99.9 /100 | #46 | Exceptional 7.9% |
| Northern Europeans | 99.9 /100 | #47 | Exceptional 7.9% |
| Afghans | 99.9 /100 | #48 | Exceptional 8.0% |
| Guamanians/Chamorros | 99.9 /100 | #49 | Exceptional 8.0% |
| Belgians | 99.9 /100 | #50 | Exceptional 8.0% |
| Koreans | 99.9 /100 | #51 | Exceptional 8.0% |
| Hawaiians | 99.9 /100 | #52 | Exceptional 8.0% |
| Slovenes | 99.9 /100 | #53 | Exceptional 8.0% |
| Immigrants | Venezuela | 99.9 /100 | #54 | Exceptional 8.1% |
| Celtics | 99.9 /100 | #55 | Exceptional 8.1% |
| Immigrants | Afghanistan | 99.9 /100 | #56 | Exceptional 8.1% |
| Venezuelans | 99.8 /100 | #57 | Exceptional 8.1% |
| Immigrants | Mexico | 99.8 /100 | #58 | Exceptional 8.1% |
| Immigrants | India | 99.8 /100 | #59 | Exceptional 8.2% |
| Immigrants | Laos | 99.8 /100 | #60 | Exceptional 8.2% |
| Thais | 99.8 /100 | #61 | Exceptional 8.2% |
| Chinese | 99.8 /100 | #62 | Exceptional 8.2% |
| Slovaks | 99.8 /100 | #63 | Exceptional 8.3% |
| Croatians | 99.8 /100 | #64 | Exceptional 8.3% |
| Canadians | 99.7 /100 | #65 | Exceptional 8.3% |
| Palestinians | 99.7 /100 | #66 | Exceptional 8.3% |