Immigrants from Western Africa vs Palestinian No Vehicles in Household
COMPARE
Immigrants from Western Africa
Palestinian
No Vehicles in Household
No Vehicles in Household Comparison
Immigrants from Western Africa
Palestinians
15.0%
NO VEHICLES IN HOUSEHOLD
0.0/ 100
METRIC RATING
303rd/ 347
METRIC RANK
8.3%
NO VEHICLES IN HOUSEHOLD
99.7/ 100
METRIC RATING
66th/ 347
METRIC RANK
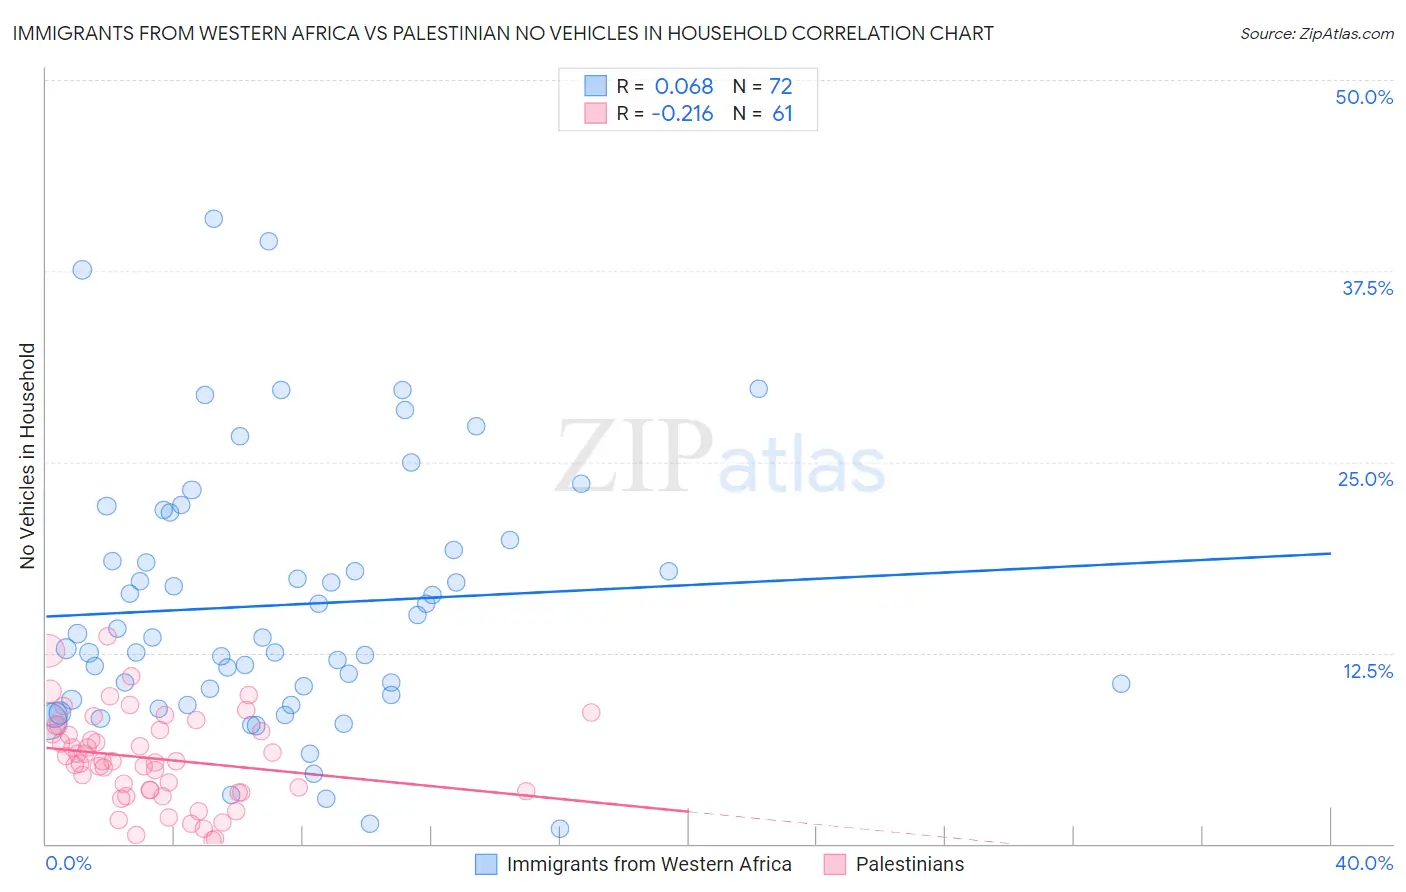
Immigrants from Western Africa vs Palestinian No Vehicles in Household Correlation Chart
The statistical analysis conducted on geographies consisting of 356,981,252 people shows a slight positive correlation between the proportion of Immigrants from Western Africa and percentage of households with no vehicle available in the United States with a correlation coefficient (R) of 0.068 and weighted average of 15.0%. Similarly, the statistical analysis conducted on geographies consisting of 216,223,800 people shows a weak negative correlation between the proportion of Palestinians and percentage of households with no vehicle available in the United States with a correlation coefficient (R) of -0.216 and weighted average of 8.3%, a difference of 80.0%.
No Vehicles in Household Correlation Summary
| Measurement | Immigrants from Western Africa | Palestinian |
| Minimum | 1.0% | 0.29% |
| Maximum | 40.9% | 13.6% |
| Range | 39.9% | 13.3% |
| Mean | 15.6% | 5.6% |
| Median | 13.5% | 5.4% |
| Interquartile 25% (IQ1) | 9.6% | 3.4% |
| Interquartile 75% (IQ3) | 19.6% | 7.6% |
| Interquartile Range (IQR) | 10.0% | 4.2% |
| Standard Deviation (Sample) | 8.6% | 3.0% |
| Standard Deviation (Population) | 8.5% | 3.0% |
Similar Demographics by No Vehicles in Household
Demographics Similar to Immigrants from Western Africa by No Vehicles in Household
In terms of no vehicles in household, the demographic groups most similar to Immigrants from Western Africa are Haitian (14.9%, a difference of 0.52%), Immigrants from Russia (15.1%, a difference of 0.66%), Immigrants from Ukraine (14.9%, a difference of 0.99%), Yuman (14.9%, a difference of 1.0%), and Immigrants from China (15.2%, a difference of 1.0%).
| Demographics | Rating | Rank | No Vehicles in Household |
| Immigrants | Spain | 0.0 /100 | #296 | Tragic 14.5% |
| Immigrants | Panama | 0.0 /100 | #297 | Tragic 14.6% |
| Moroccans | 0.0 /100 | #298 | Tragic 14.7% |
| Immigrants | Greece | 0.0 /100 | #299 | Tragic 14.7% |
| Yuman | 0.0 /100 | #300 | Tragic 14.9% |
| Immigrants | Ukraine | 0.0 /100 | #301 | Tragic 14.9% |
| Haitians | 0.0 /100 | #302 | Tragic 14.9% |
| Immigrants | Western Africa | 0.0 /100 | #303 | Tragic 15.0% |
| Immigrants | Russia | 0.0 /100 | #304 | Tragic 15.1% |
| Immigrants | China | 0.0 /100 | #305 | Tragic 15.2% |
| Immigrants | Belize | 0.0 /100 | #306 | Tragic 15.4% |
| Immigrants | Haiti | 0.0 /100 | #307 | Tragic 15.4% |
| U.S. Virgin Islanders | 0.0 /100 | #308 | Tragic 15.4% |
| Puerto Ricans | 0.0 /100 | #309 | Tragic 15.5% |
| Cape Verdeans | 0.0 /100 | #310 | Tragic 15.6% |
Demographics Similar to Palestinians by No Vehicles in Household
In terms of no vehicles in household, the demographic groups most similar to Palestinians are Immigrants from Scotland (8.3%, a difference of 0.010%), Canadian (8.3%, a difference of 0.11%), Immigrants from Iran (8.4%, a difference of 0.41%), Spaniard (8.4%, a difference of 0.46%), and Croatian (8.3%, a difference of 0.86%).
| Demographics | Rating | Rank | No Vehicles in Household |
| Immigrants | India | 99.8 /100 | #59 | Exceptional 8.2% |
| Immigrants | Laos | 99.8 /100 | #60 | Exceptional 8.2% |
| Thais | 99.8 /100 | #61 | Exceptional 8.2% |
| Chinese | 99.8 /100 | #62 | Exceptional 8.2% |
| Slovaks | 99.8 /100 | #63 | Exceptional 8.3% |
| Croatians | 99.8 /100 | #64 | Exceptional 8.3% |
| Canadians | 99.7 /100 | #65 | Exceptional 8.3% |
| Palestinians | 99.7 /100 | #66 | Exceptional 8.3% |
| Immigrants | Scotland | 99.7 /100 | #67 | Exceptional 8.3% |
| Immigrants | Iran | 99.7 /100 | #68 | Exceptional 8.4% |
| Spaniards | 99.7 /100 | #69 | Exceptional 8.4% |
| Cajuns | 99.6 /100 | #70 | Exceptional 8.4% |
| Immigrants | Lebanon | 99.6 /100 | #71 | Exceptional 8.4% |
| Lithuanians | 99.6 /100 | #72 | Exceptional 8.4% |
| Poles | 99.6 /100 | #73 | Exceptional 8.4% |